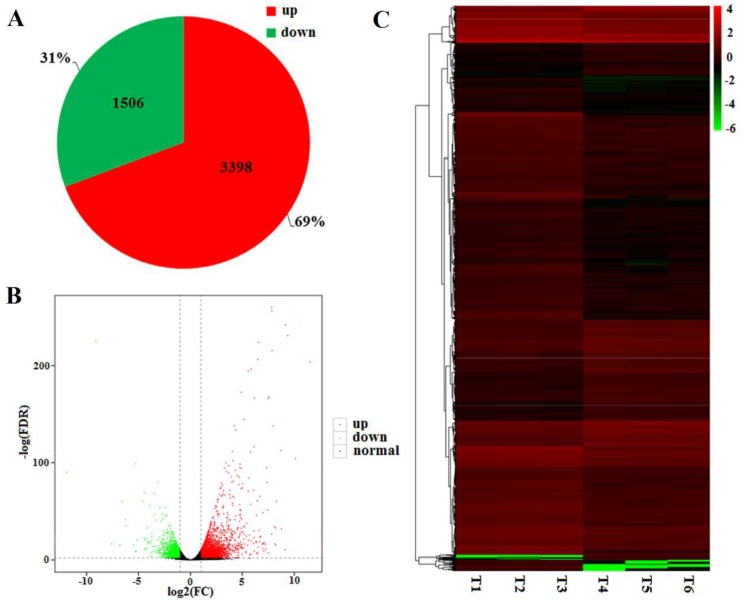
Figure 3.
Expression level of DEGs in the mutant dmc compared to WT. (A) Pie chart of DEGs; (B) volcano plots of DEGs. The red and green dots represent genes expressed at high and low levels, respectively, in the mutant dmc; FC: Fold Change; FDR; false discovery rate; (C) Heatmap of DEGs. T1, T2, T3: mutant dmc; T4, T5, T6: WT. The color scale indicates the Log2 FPKM values.

