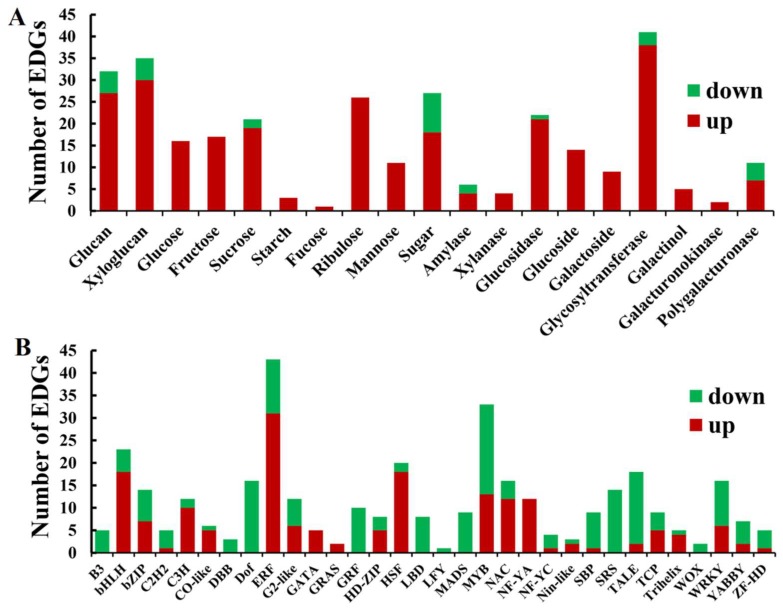
Figure 8.
A bar chart of the DEGs involved in carbohydrate metabolisms and the transcription factors. (A) Classification of the DEGs involved in carbohydrate metabolisms. x-axis: the subcategories of carbohydrate metabolisms, y-axis: the number of DEGs in each subcategory; (B) Classification of the differentially-expressed transcription factors. x-axis: The subfamilies of transcription factors, y-axis: the number of DEGs in each family of transcription factors. Red: highly-expressed DEGs; green: DEGs expressed at a low level.

