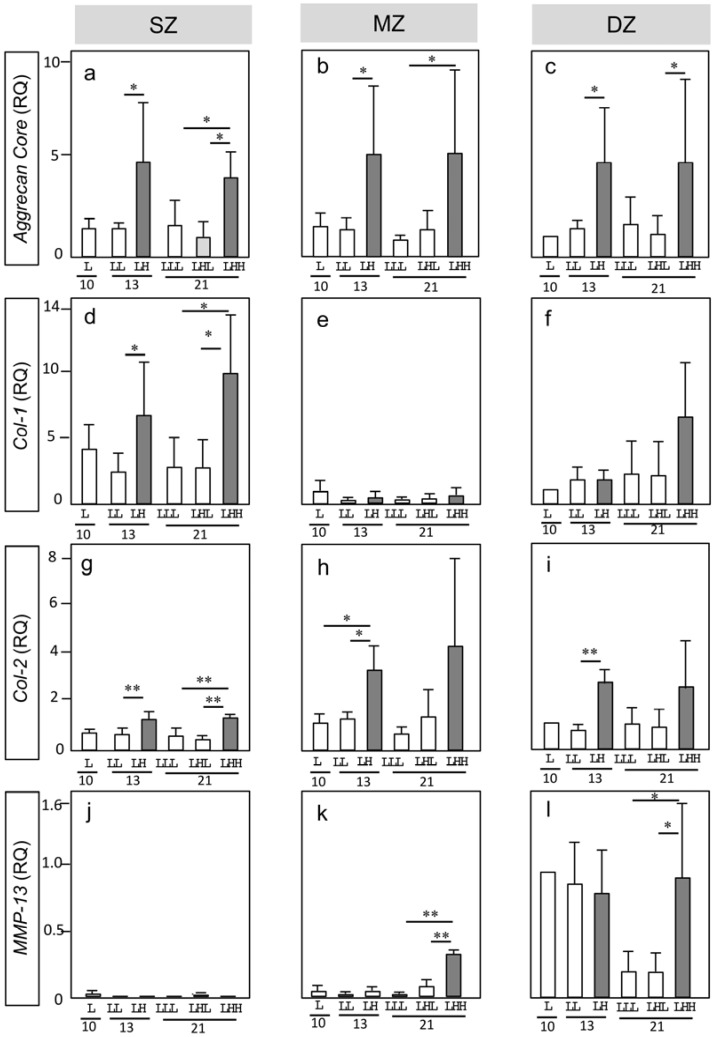
Figure 3.
Gene expression by longitudinal depth zone-derived chondrocytes forming spheroids. Relative quantity (RQ) Asterisks indicate significant difference among groups (* p < 0.05, ** p < 0.01). A bar indicates SD. Collagen type Iα1 (Col-1); collagen type IIα1 (Col-2); matrix metalloproteinase-13 (MMP-13).

