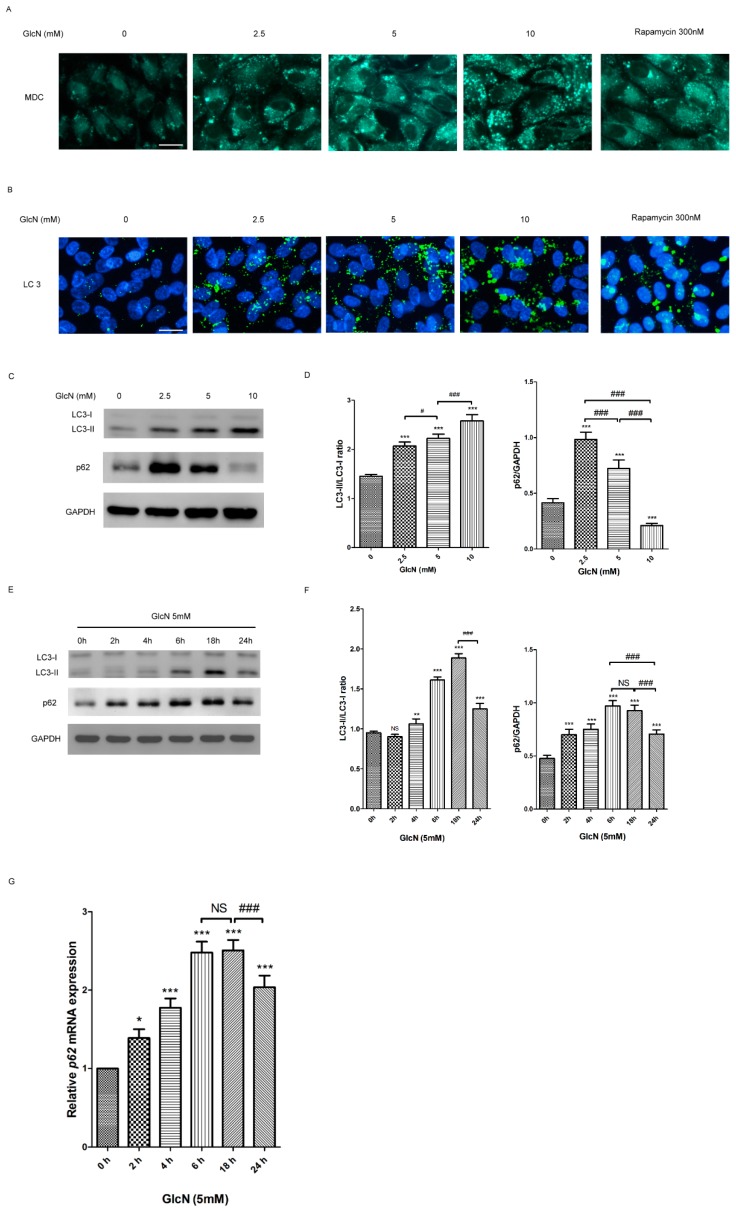
Figure 2.
Glucosamine (GlcN) increases autophagosome and autophagic markers in ARPE-19 cells. (A) The number of monodansylcadaverine (MDC)-labeled vacuoles increased by either GlcN or rapamycin (Rapa) treatment in ARPE-19 cells. Cells were treated with or without 2.5 mM GlcN, 5 mM GlcN, 10 mM GlcN, or 300 nM rapamycin (Rapa) for 18 h and then stained with MDC. Rapa treatment was used as a positive control. MDC-labeled vacuoles were examined by fluorescence microscopy. Magnification, ×400; Scale bar: 20 μm. (B) The number of cytoplasmic LC3 puncta increased by either GlcN or Rapa treatment in ARPE-19 cells. Cells were treated with or without 2.5 mM GlcN, 5 mM GlcN, 10 mM GlcN, or 300 nM rapamycin (Rapa) for 18 h and then stained with anti-LC3 antibody. The cytoplasmic LC3 puncta were examined by fluorescence microscopy. Nuclei were counterstained with DAPI. Magnification, ×400; Scale bar: 20 μm. (C) Effect of GlcN on the expression of LC3-II and p62 protein in ARPE-19 cells. Cells were treated with the indicated concentrations of GlcN (0, 2.5, 5, and 10 mM) for 18 h. Whole-cell lysates were prepared and analyzed with immunoblotting using anti-LC3, anti-p62, and anti-GAPDH antibodies. (D) Optical density of the Western blot bands for LC3-I, LC3-II, p62, and GAPDH was analyzed. The results are represented as the mean ± SEM. The differences in the LC3-II/LC3-I ratios and p62/GAPDH in ARPE-19 cells between the groups were compared using ANOVA. Tukey’s test was used for the post hoc analysis; *** p < 0.001 versus the control group; # p < 0.05; ### p < 0.001. (E) The cells were treated with 5 mM GlcN for the indicated time (0, 2, 4, 6, 18, and 24 h). Whole-cell lysates were prepared and analyzed by immunoblotting using anti-LC3, anti-p62, and anti-GAPDH antibodies. (F) Optical density of the Western blot bands for LC3-I, LC3-II, p62, and GAPDH was analyzed. The results are represented as the mean ± SEM. The differences in the LC3-II/LC3-I ratios and p62/GAPDH in ARPE-19 cells between the groups were compared using ANOVA. Tukey’s test was used for the post hoc analysis; ns, not significant; ** p < 0.01 versus the control group; *** p < 0.001 versus the control group; ### p < 0.001. (G) The cells were treated with 5 mM GlcN for the indicated time (0, 2, 4, 6, 18, and 24 h). The levels of p62 mRNA were quantified by using qPCR. The results are represented as the mean ± SEM. The relative p62 mRNA expression in ARPE-19 cells between the groups were compared using ANOVA. Tukey’s test was used for the post hoc analysis; ns, not significant; * p < 0.05 versus the control group; *** p < 0.001 versus the control group; ### p < 0.001.

