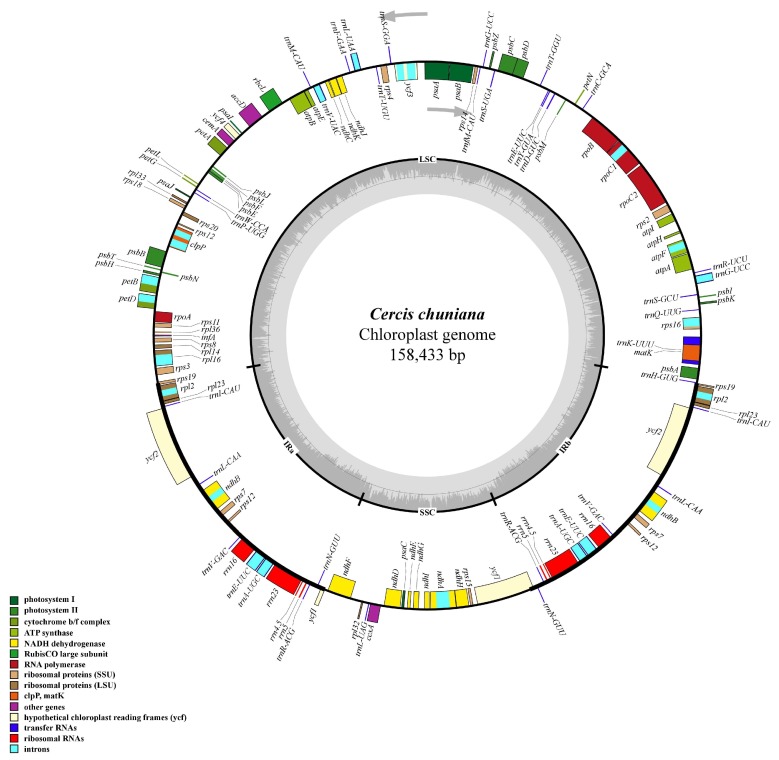
Figure 1.
Gene map of the Cercis chuniana cp genome. The genes lying inside and outside the outer circle are transcribed in clockwise and counterclockwise direction, respectively (as indicated by arrows). Colors denote the genes belonging to different functional groups. The hatch marks on the inner circle indicate the extent of the inverted repeats (IRa and IRb) that separate the small single copy (SSC) region from the large single copy (LSC) region. The dark gray and light gray shading within the inner circle correspond to percentage G + C and A + T content, respectively.

