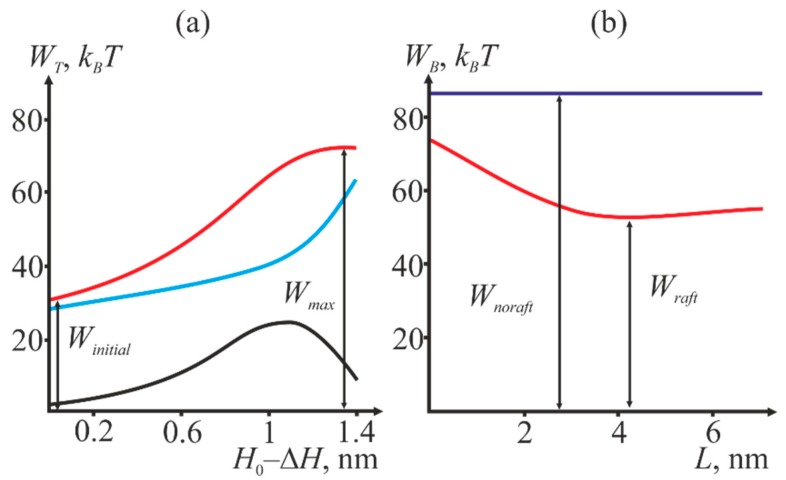
Figure 4.
(a) Dependence of the system total energy WT (shown in red) on the reaction coordinate H0 − ΔH. The blue curve is the deformation energy of the two membranes, the black one is the energy of hydration repulsion of the membranes and hydrophobic interaction of the defects. The graph corresponds to the values of R = 3 nm, L = 3 nm, H0 = 3 nm. (b) Dependence of the energy barrier WB to stalk formation on the width L of the raft transient zone (shown in red). The energy barrier in the absence of raft in the target cell membrane is shown in blue. The graph corresponds to the values of R = 3 nm, H0 = 4 nm.

