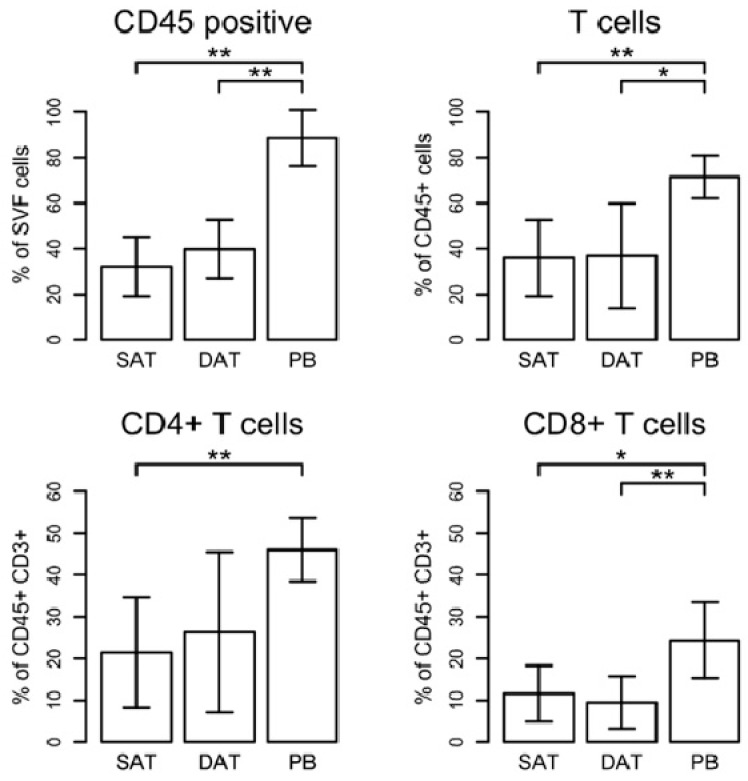
Figure 5.
Analysis of T-cells in SAT, DAT, and peripheral blood cells (PB). Gating strategy is shown in Figure 4A. The percentages of T-cells were calculated based on the numbers of CD45+ cells. CD8+ T-cells were discriminated from CD4+ T-helper cells on the basis of expression of CD8 marker. CD4+ T-cells were determined as CD8- cells. Results represent data from six patients and are expressed as mean ± SD. Significance was assessed using a paired t-test (* p-value < 0.05, ** p-value < 0.01).

