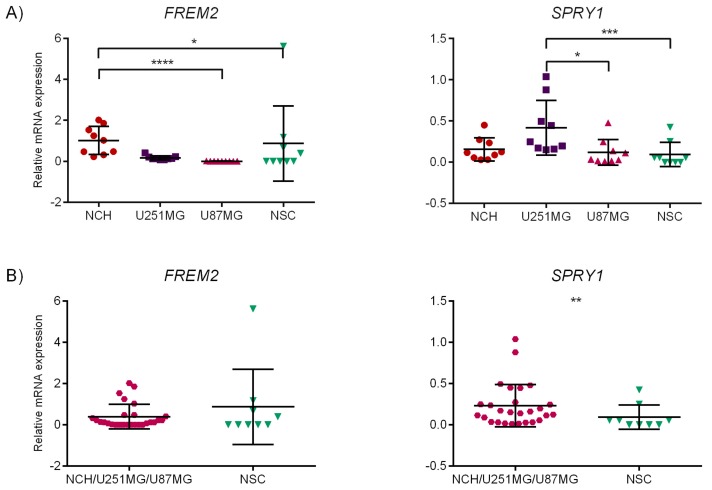
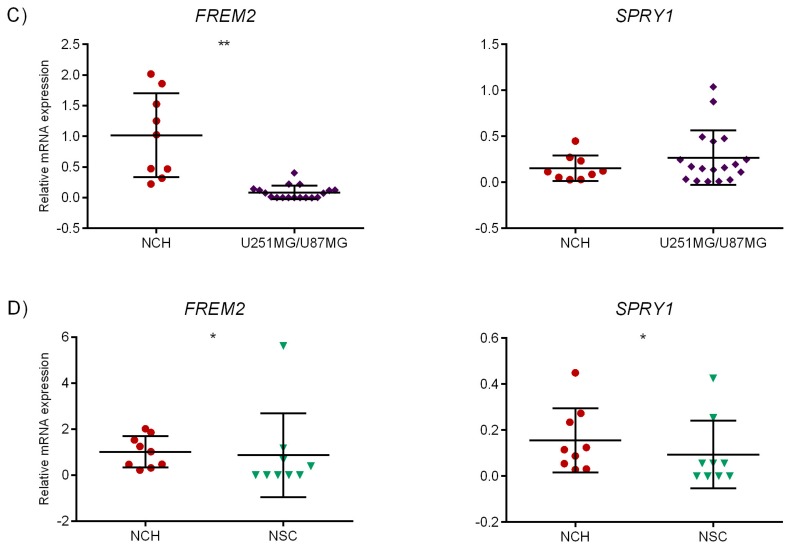
Figure 1.
Statistical analysis of qRT-PCR results. Relative mRNA expression levels for FREM2 and SPRY1 for NCH, U251MG, U87MG, and NSC. Mean gene expression value is presented on the scatter plot (middle line) with error bars representing standard deviation (SD). x-axis: samples; y-axis: relative mRNA expression. * p ≤ 0.05, ** p < 0.01, *** p < 0.001, **** p < 0.0001. (A) Kruskal–Wallis test with Dunn’s correction: NCH vs. U87MG: FREM2—significant difference (p < 0.0001). NCH vs. NSC: FREM2—significant difference (p = 0.0489). U251MG vs. U87MG: SPRY1—significant difference (p = 0.0155). U251MG vs. NSC: SPRY1—significant difference (p = 0.0004). (B) Mann–Whitney test: NCH/U251MG/U87MG vs. NSC: SPRY1—significant difference (p = 0.0025). (C) Unpaired t-test with Welch’s correction: NCH vs. U251MG/U87MG: FREM2—significant difference (p = 0.0030). (D) Mann–Whitney test: NCH vs. NSC: FREM2—significant difference (p = 0.0181). NCH vs. NSC: SPRY1—significant difference (p = 0.0227).


