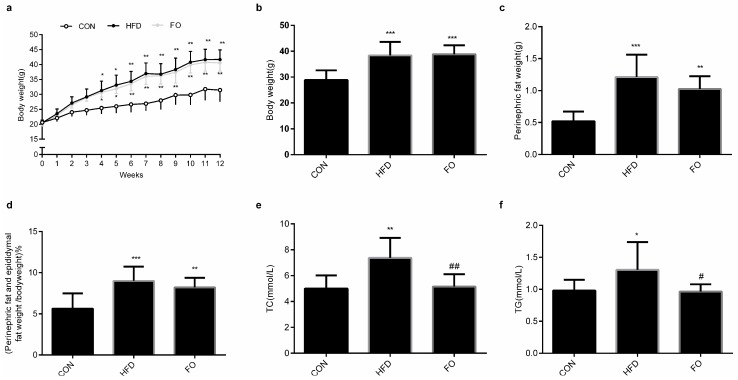
Figure 1.
Phenotypic comparison of mice fed the control (CON), high fat diet (HFD), or fish oil (FO) diets for 12 weeks. (a) Body weight of mice at 12 weeks. At the end of week 12, the body weight of the three groups (b), perinephric fat weight (c), the perinephric and epididymal fat weight/body weight ratio (d), the plasma total cholesterol (TC) (e) and triacylglycerol (TG) (f). Data are expressed as mean ± SD (n = 10 per group). * p < 0.05, ** p < 0.01, *** p < 0.001 vs. CON group; # p < 0.05, ## p < 0.01 vs. HFD group.

