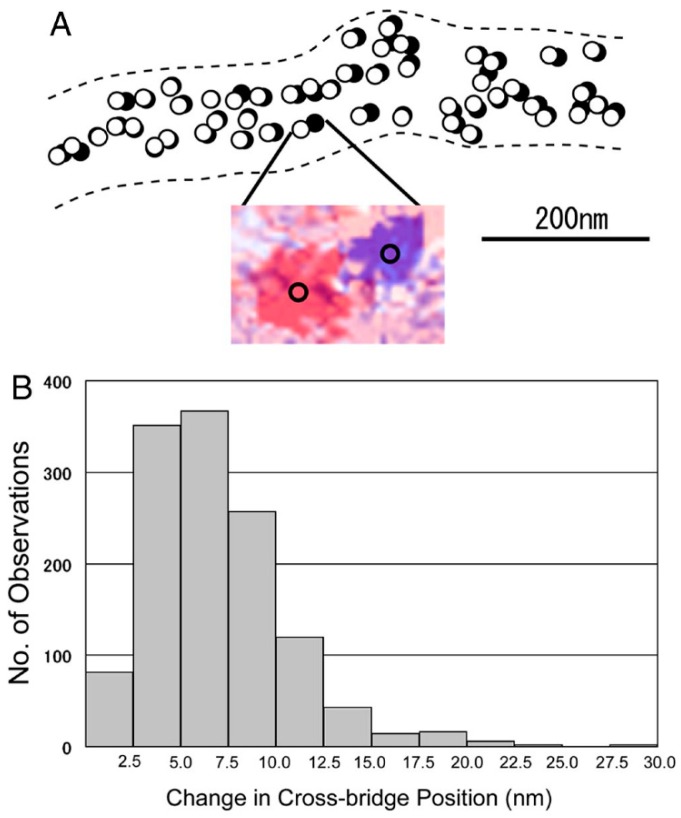
Figure 7.
ATP-induced myosin head movement in the absence of actin filaments. (A) Comparison of the myosin head position between the two IP records, taken before and after ATP application, respectively. Open and filled circles (diameter, 20 nm) are drawn around the centre of mass position of the same particles before and after ATP application, respectively. (Inset) An example of superimposed IP records showing the change in position of the same particle, which are colored red (before ATP application) and blue (after ATP application). The center of mass position for each particle image is located at the center of the circle on the particle image. (B) Histogram of amplitude distribution of ATP-induced myosin head movement. From Sugi et al., [6].

