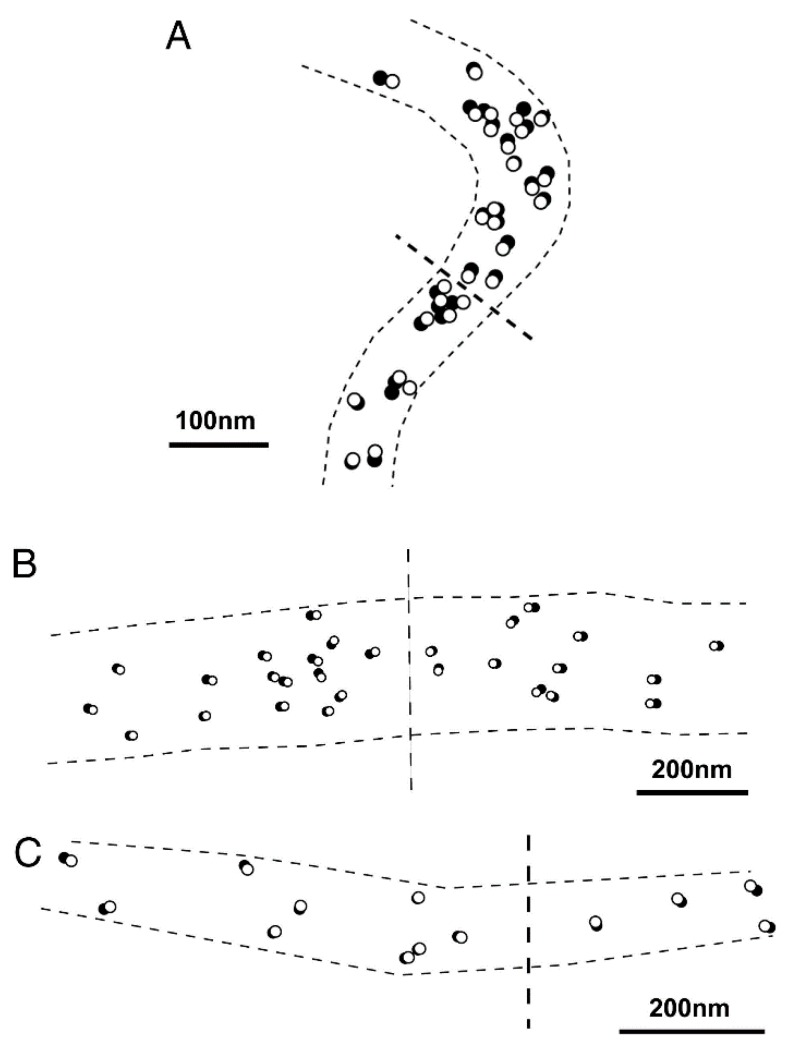
Figure 8.
(A−C) Examples of IP records showing the ATP-induced myosin head movement at both sides of myosin filament bare region, across which myosin head polarity is reversed. Open and filled circles (diameter, 20 nm) are drawn around the center of mass positions of the same particles in the IP records, taken before and after ATP application, respectively. Note that myosin heads move away from the bare region. Approximate location of the bare region is indicated by broken lines across the center of myosin filament. From Sugi et al., [6].

