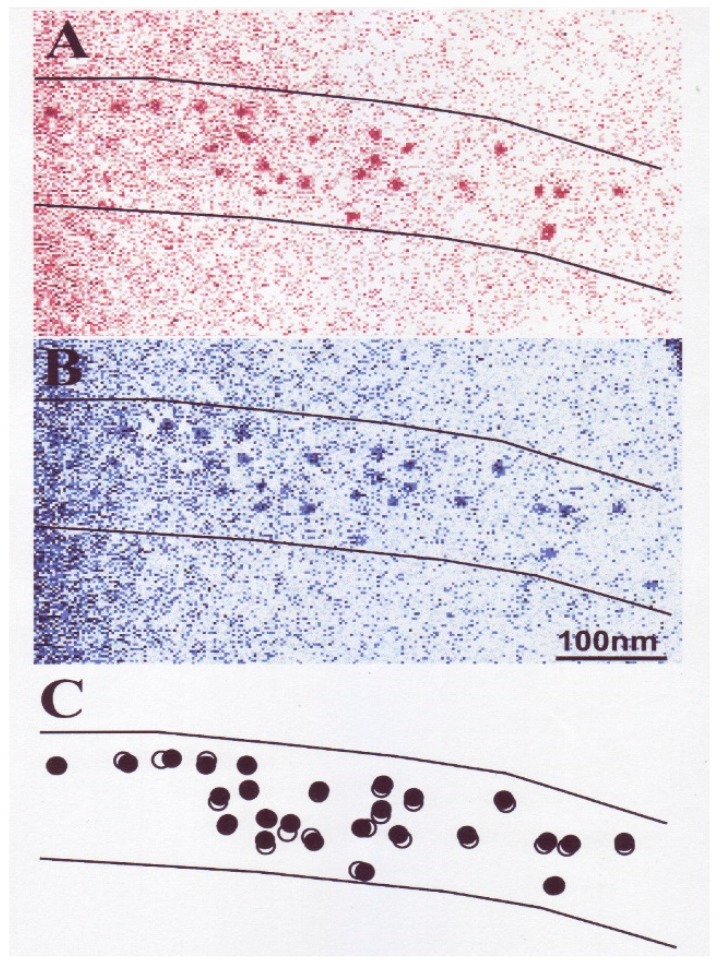
Figure 15.
(A,B) A pair of IP records of the same myosin filament in the filament mixture. Records A and B were taken before and after ATP application, respectively. Recordings were made at low KCL concentration (20 mM). (C) diagram showing ATP-induced changes in position of gold particles attached to individual myosin heads with antibody 2. Open and filled circles (diameter, 20 nm) were drawn around the center of mass positions of the same particles before and after ATP application, respectively. From Sugi et al., [10].

