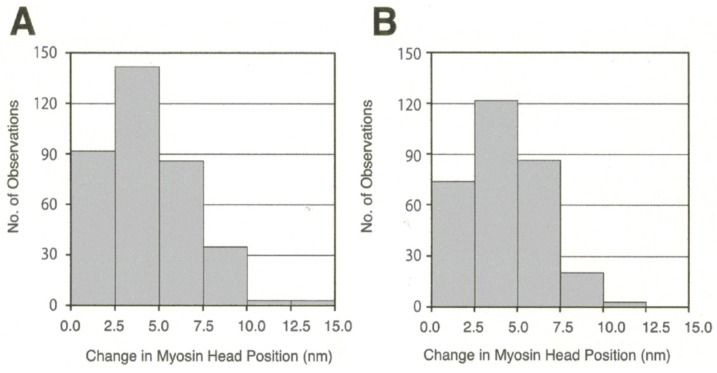
Figure 16.
Histograms showing the amplitude distribution of ATP-induced myosin head power stroke at external KCl concentration of 20 mM. Individual myosin heads were position-marked with antibody 1 at the distal region of myosin head CAD in (A), and with antibody 2 at the proximal region of myosin head CAD in (B). From Sugi et al., [10].

