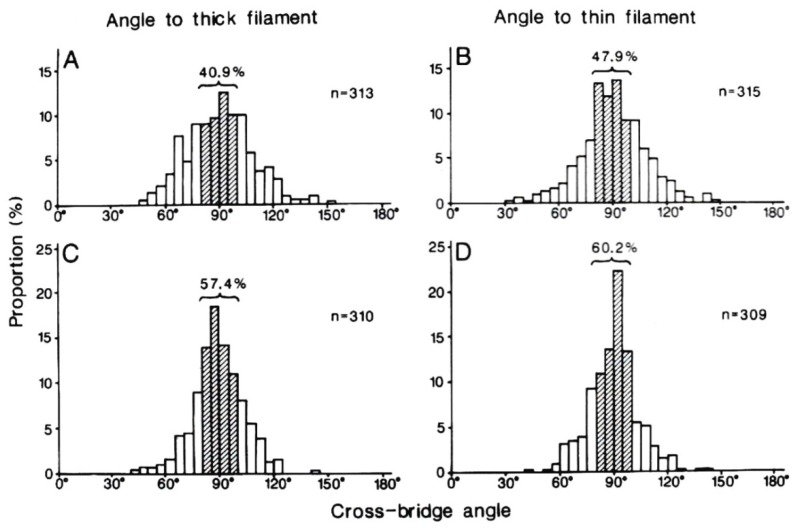
Figure 23.
Histograms showing angular distribution of cross-bridges (myosin heads) to the thick (myosin) and the thin (actin) filaments in relaxed (A,B) and contracting (C,D) states. Number of measurements is given alongside each histogram. Histograms on the left side and on the right side shows myosin head angles to the thick (myosin) and to the thin (actin) filaments, respectively. From Suzuki et al. [28].

