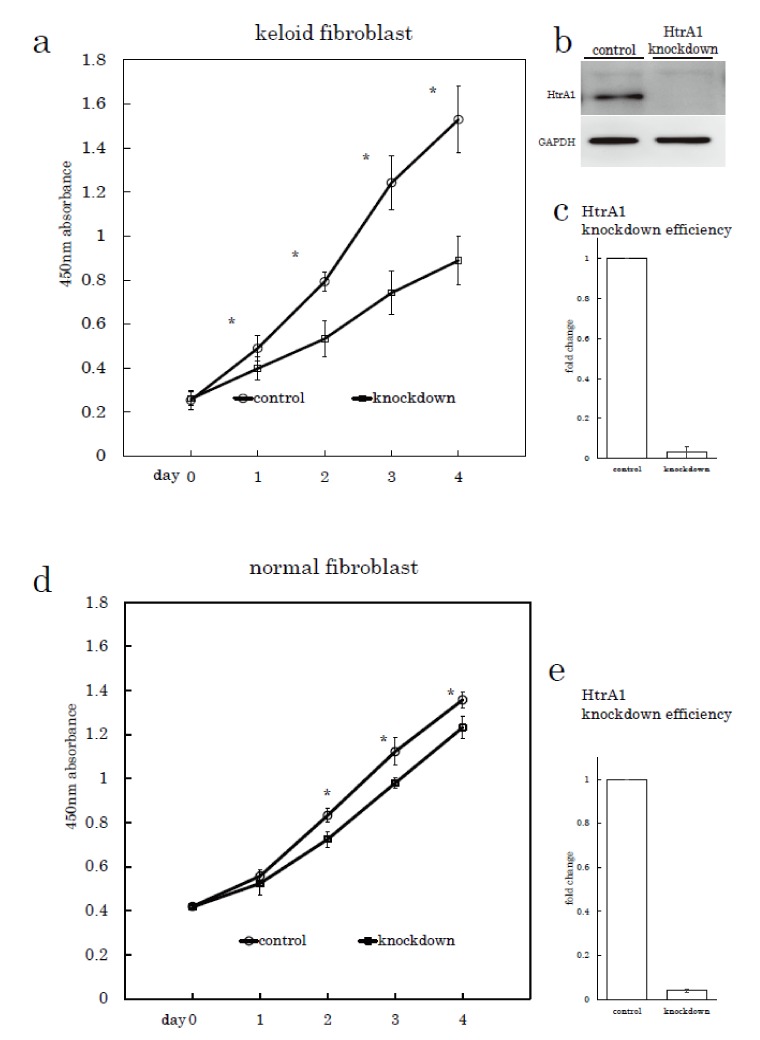
Figure 6.
Proliferation rates of keloid fibroblasts and normal fibroblasts transfected with HtrA1 siRNA or control siRNA. Proliferation curves of keloid fibroblasts obtained from keloid sample No. 26 as shown in Table 1 (a), (n = 3) and normal fibroblasts from sample No. 8 (d) transfected with HtrA1 siRNA (knockdown) or control siRNA (control). The efficiency of HtrA1 knockdown in keloid fibroblasts was determined using western blot analysis (b) and quantitative PCR (c), (n = 3). The efficiency of HtrA1 knockdown in normal fibroblasts was similarly determined using quantitative PCR (e), n = 3. Cell proliferation was analysed using a colorimetric assay with a water-soluble tetrazolium salt as the substrate. Error bars represent standard deviations (n = 3). * p < 0.001.

