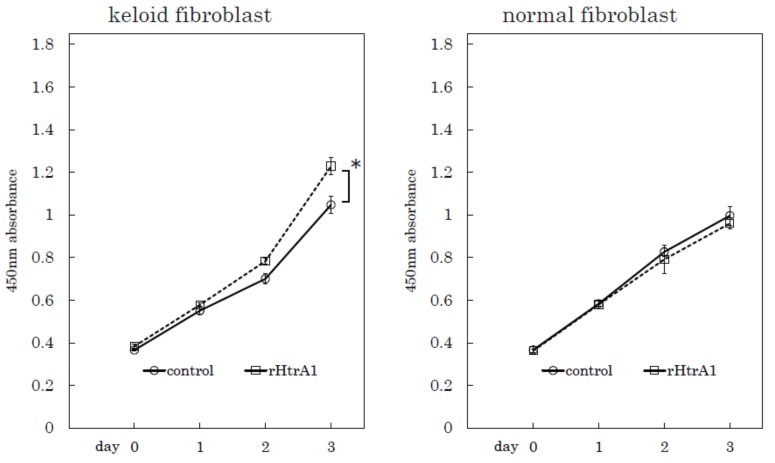
Figure 7.
Proliferation rates of keloid fibroblasts and normal fibroblasts incubated with or without recombinant HtrA1. Proliferation curves of keloid fibroblasts obtained from sample No. 29 and normal fibroblasts from sample No. 8 as shown in Table 1, incubated with (rHtrA1) or without (control) recombinant HtrA1. n = 3, * p < 0.01.

