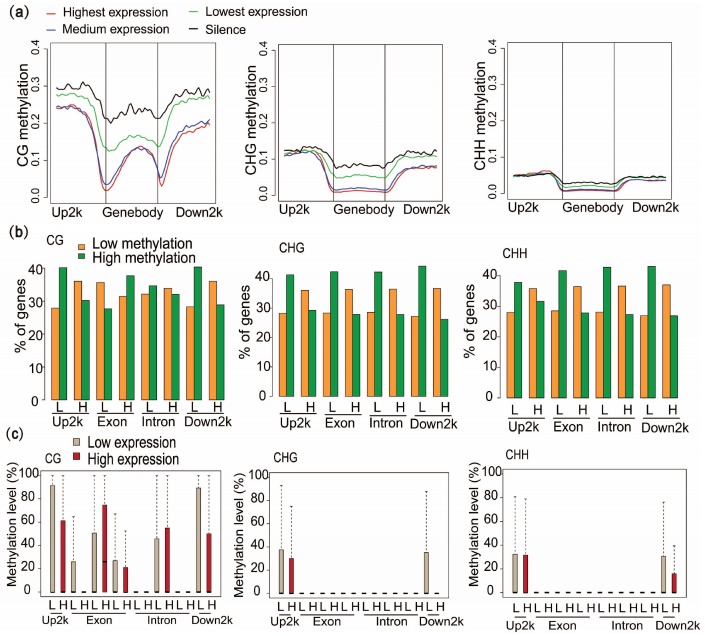
Figure 4.
Methylation at various genic regions differentially associated with gene expression. (a) Association between methylation and gene expression levels in the CG, CHG and CHH contexts. Genes were sorted into four groups based on their gene expression levels. Highest expression: gene expression ≥10; medium expression: 1 < gene expression < 10; lowest expression: 0 < gene expression ≤ 1; silence: gene expression = 0. (b) Comparison of gene expression and methylation levels for mCG, mCHG and mCHH sites, and for each genic region: upstream 2-kb regions (Up2k), exons, introns and downstream 2-kb regions (Down2k). Low and high methylation represent the one-third of genes with the lowest and highest methylation levels with respect to each genic region, respectively. L and H at the bottom of the bars indicate the one-third of genes with the lowest or highest expression levels, respectively. Gene percentages were calculated separately for each L or H expression group. (c) Comparison of average methylation levels (%) between low and high expression genes for mCG, mCHG or mCHH sites in each genic region.

