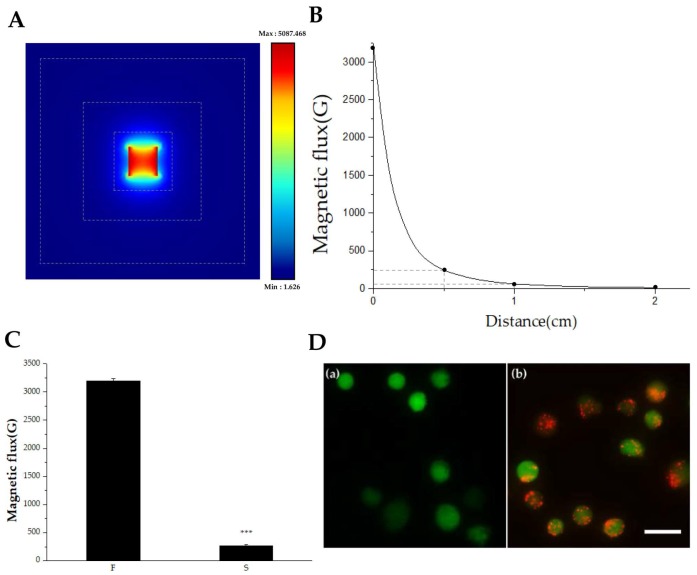
Figure 3.
Measurement of magnetic flux and visualization of IRB-loaded MSCs. (A) Simulation analysis of a permanent cube-shape magnet. The dotted lines indicate the distances from the magnetic surface, which were 5, 10, and 20 mm. Different magnetic flux values depending on distances and directions. (B) Graph of magnetic flux versus distance. The actual values of magnetic flux from a permanent magnet applied in this study were measured. Magnetic flux values were 3200, 235, 60, and 10 Gauss at 0, 5, 10, and 20 mm, marked as a black dot, respectively. (C) Different surface magnetic flux was measured depending in polar (F) and non-polar directions (S) (n = 9, ***: p ≤ 0.005). (D) IRB-loaded MSCs floating in the cell culture media were visualized with a fluorescence microscope, showing a clear difference between (a) MSCs without IRBs and (b) IRB-loaded MSCs (Scale bar: 25 μm).

