Figure 5.
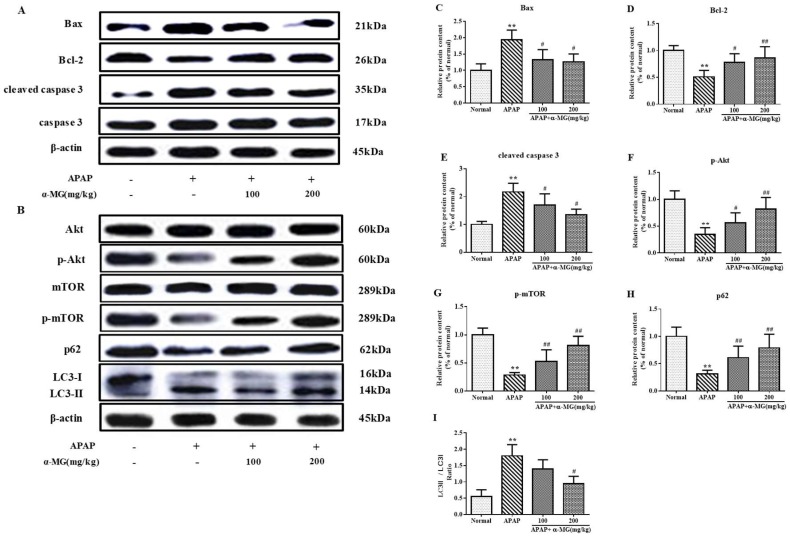
Suppression of apoptotic and autophagic pathway by α-MG using Western blotting analysis. The intensity of Bax, Bcl-2, caspase 3, cleaved caspase 3, Akt, p-Akt, m-TOR, p-m-TOR, p62 and LC3 II /LC3 I ratio were standardized to that of β-actin (A,B); Quantitative analysis of scanning densitometry for Bax (C); Bcl-2 (D); cleaved caspase 3 (E); p-Akt (F); m-TOR (G); p62 (H) and LC3 II /LC3 I ratio (I); were performed. All data are expressed as mean ± S.D., n = 8. ** p < 0.01 vs. normal group; ## p < 0.01 or # p < 0.05 vs. APAP group.

