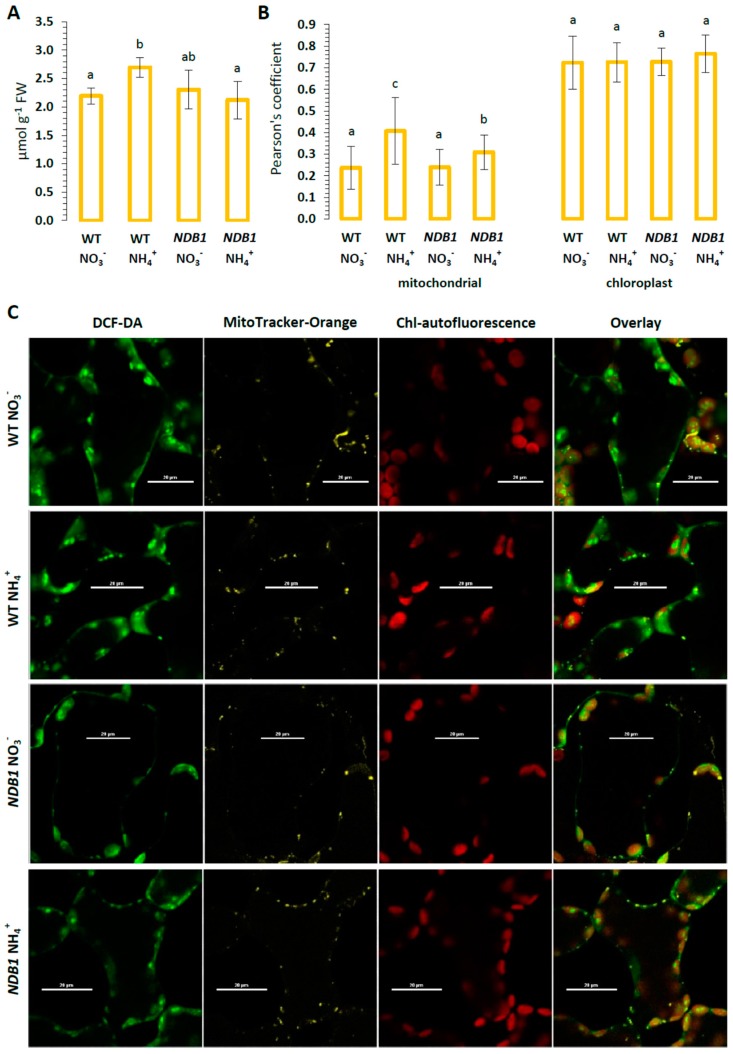
Figure 3.
Reactive oxygen species (ROS) in NDB1-suppressed and WT plants growing on NH4+ and NO3− (control) as the only source of nitrogen. (A) Hydrogen peroxide content; (B) sub-cellular ROS distribution in leaf segments. Pearson’s co-localization coefficient shows the proportion of DCF-labelling with mitochondria-dependent fluorescence or chlorophyll autofluorescence. Bars with different letters are statistically different (p < 0.05) by ANOVA; (C) The mesophyll cells of WT and NDB1 knock-downs were double-labelled with 2′,7′-dichlorodihydrofluorescein diacetate (DCF-DA, Green) and MitoTracker Orange (reduced CM-H2 TMRos, yellow), and chloroplast autofluorescence (far red) was observed; representative images from four independent biological replicates; scale bar = 20 µm.

