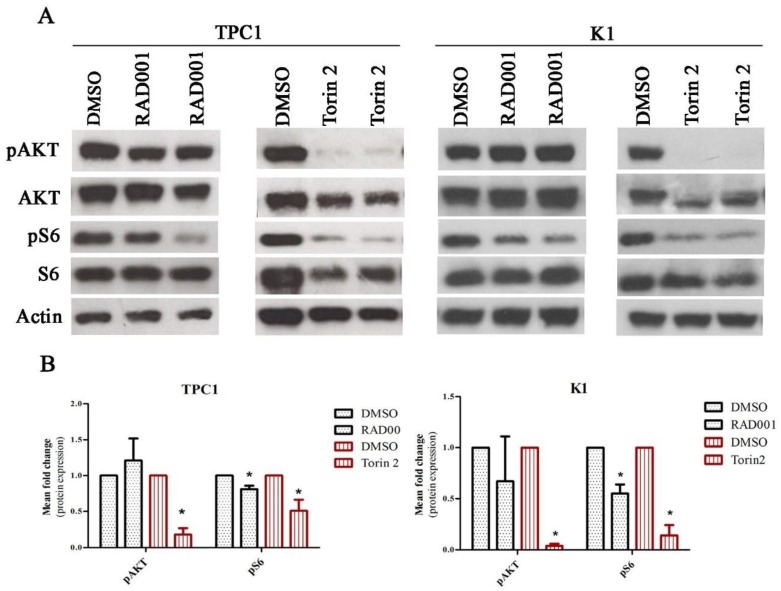
Figure 2.
RAD001 and Torin2 effect on TPC1 and K1 cell lines. (A) Cells were treated with 20 nM of RAD001 and 450 nM of Torin2 for 72 h. Western blot analysis of RAD001 and Torin2 effect on the activation status of mTORC1 and mTORC2 complexes was evaluated by phospho-S6 Ser235/236 and phospho-AKT Ser473 expression, respectively. Representative actin expression is shown. Protein level in treated cells was evaluated in duplicate. (B) Mean fold change of protein expression observed in TPC1 cell line treated with 20 nM of RAD001 and 450 nM of Torin2 in comparison to cells treated with DMSO. Phosphorylated proteins were normalized by the levels of their correspondent total proteins. Results are shown as mean expression value of three independent experiments ±SEM. * p < 0.05 (unpaired Student’s t test).

