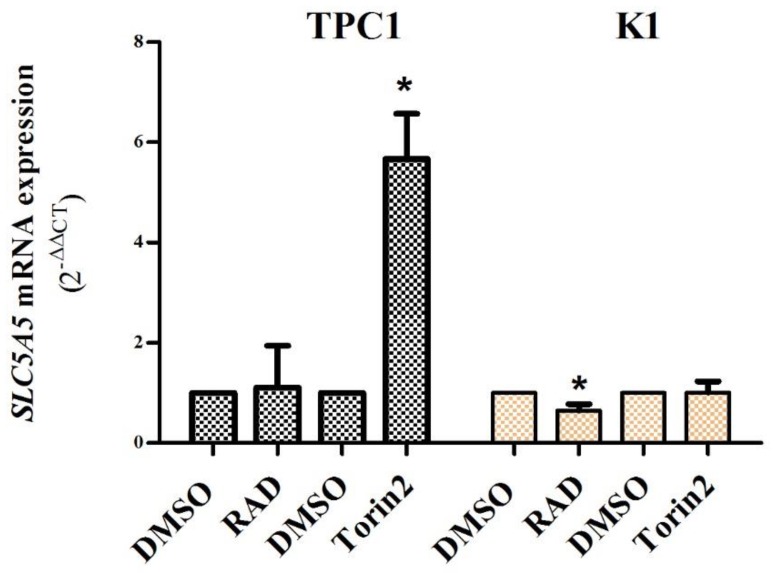
Figure 3.
SLC5A5 expression in TPC1 and K1 cell lines after treatment with RAD001 (20 nM) and Torin2 (450 nM) for 72 h. Mean fold change of SLC5A5 mRNA expression observed in TPC1 and K1 cell lines after treatment in comparison to cells treated with DMSO. Treatment with RAD001 did not affect SLC5A5 expression in the TPC1 cell line and caused a slight decrease in the K1 cell line. Treatment with Torin2 caused a significant increase (~6 fold) in SLC5A5 expression in the TPC1 cell line but not in the K1 cell line. Bars represent mean expression ± SEM. * p < 0.05. Results are shown as mean expression values of three independent experiments.

