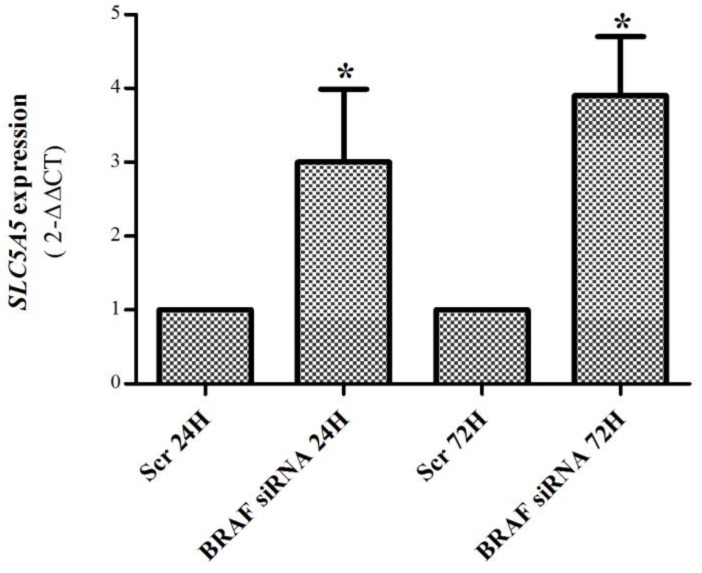
Figure 5.
SLC5A5 mRNA expression in K1 cell line after BRAF silencing (50 nM, 24 and 72 h). BRAF silencing caused a significant (~3 fold) increase in SLC5A5 mRNA expression at both time points. Bars represent mean expression ± SEM. * p < 0.05. Results are shown as mean expression values of two independent experiments, each one with three replicates.

