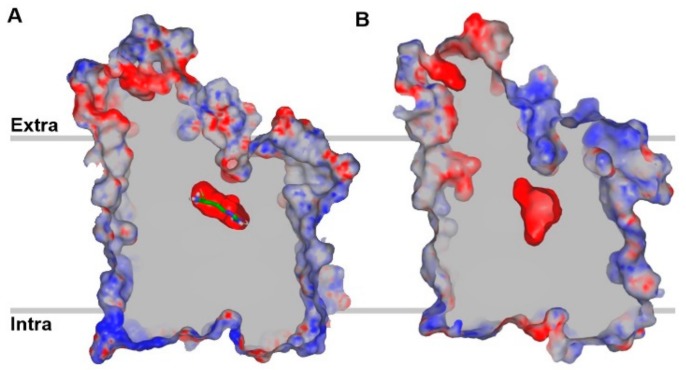
Figure 7.
Centrally sliced structure of the electrostatic potential molecular surface of arginine-bound AdiC (A) and an outward-occluded model of LAT1 (B) showing the negative surface potential of the substrate binding cavity. The red and blue regions indicate negative and positive surface potential, respectively, while grey indicates the surface capping color. Arginine is shown in stick representation in (A). The binding pocket of LAT1 is predicted to be large and broad in size as compared to AdiC.

