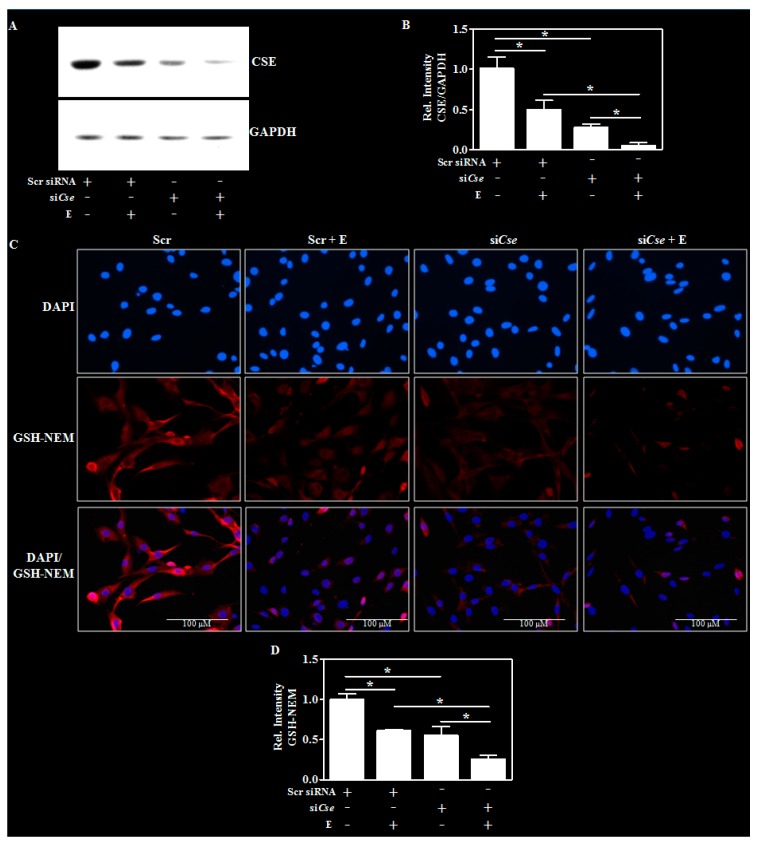
Figure 5.
Effect of Cse knockdown on the E-induced glutathione changes in differentiated neurons. The transfection and the differentiation procedures were performed as in the Figure 4E except for the addition of E (4 mg/mL) after 24 h of transfection for an additional period of 24 h. A representative Western blot image of CSE and GAPDH (A) and the quantification of CSE protein relative to GAPDH (n = 3) (B); Cells were transfected and treated as in panel A and NEM was added to generate NEM-GSH adducts during permeabilization with methanol. Cell were then immunostained with antibody for GSH-NEM (red). The slides were counterstained with DAPI to identify nuclei (blue) and the images were captured at 40× magnification, with the scale bar indicating 100 μM. The specificity was validated by an absence of GSH-NEM signal in cells treated with NEM (data not shown) (C); Quantification of the neuronal GSH-NEM immunolabeled signals by Image J analysis (Bethesda, MD, USA) (D). Values represent the mean ± SEM. * p < 0.05 was considered significant.

