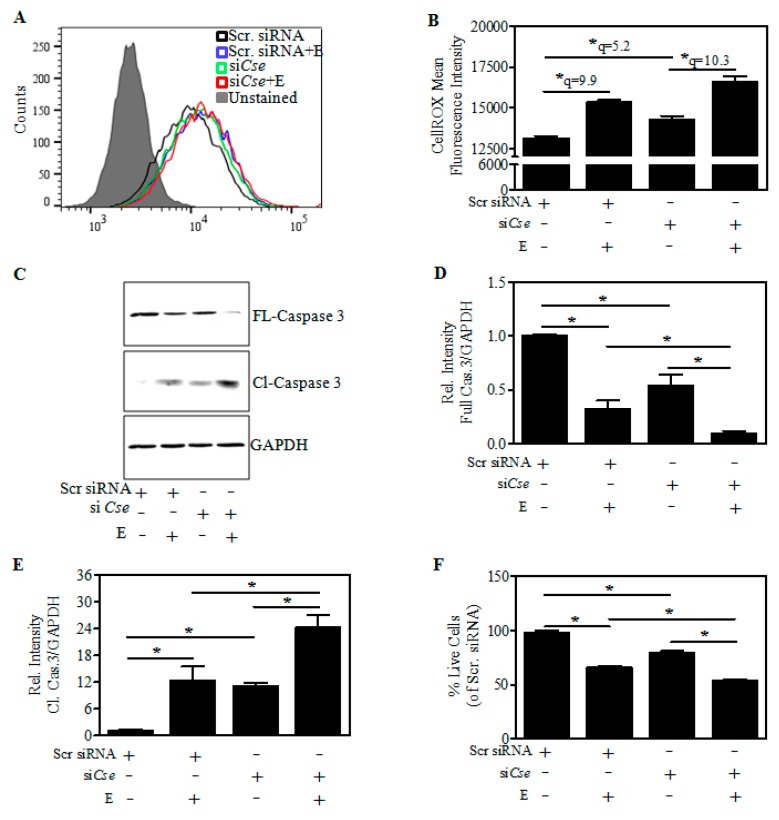
Figure 6.
Effect of Cse knockdown on the E-induced cellular ROS changes and associated death of differentiated neurons. Transfection and the differentiation procedure were performed as in the Figure 5A. At the end of the experiment, the cells were stained with ROS-reactive dye, CellROX Green for 30 min and subjected to flow cytometry analysis. A representative Fluorescent-Activated Cell Sorting (FACS) histogram of scramble control (black line), scramble + E (blue line), siCse (green line), siCse + E (red line) stained with CellROX and an unstained control (filled grey) (A) and the quantification of CellROX-Mean fluorescent intensity (n = 3) (B); Cells were transfected and treated as in panel A followed by Western blotting. A representative immunoblot of the full length/inactive (FL) and cleaved/active (Cl) caspase-3 with GAPDH as a loading control (C); Densitometric quantification of the FL-caspase-3:GAPDH (n = 3) (D) and Cl-caspase-3:GAPDH was shown as the relative intensity of Scramble siRNA control (n = 3) (E); Cells were transfected and treated as in panel A and cell viability was determined by MTT assay. The result was shown as the percentage of scramble siRNA control (n = 6) (F). Data are represented as the mean ± SEM. * p < 0.05 was considered statistically significant.

