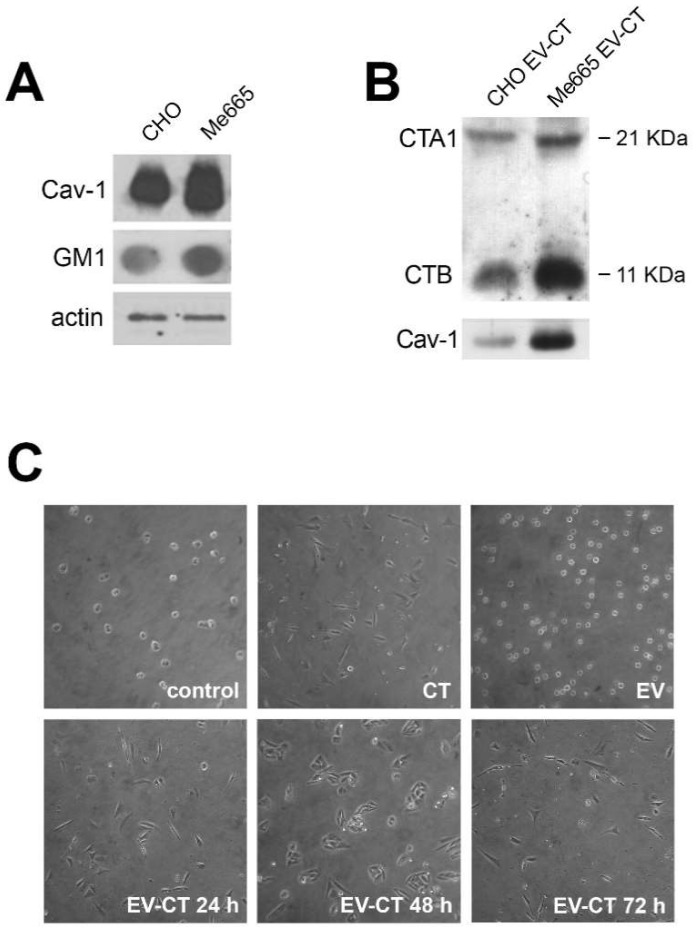
Figure 1.
Expression of Cav-1 and GM1 in CHO and Me665 cells and morphological changes in CHO cells induced by CT-positive EVs (EV-CT) (A) Western blot analysis for Cav-1 and Dot blot analysis for GM1 of CHO and Me665 cell lines. For SDS-PAGE 30 µg of cell lysates were used and for Dot Blot 40 µg/dot. The presence of GM1 was assessed using horseradish peroxidase (HRP)-conjugated CTB. Actin is shown for normalization; (B) EVs collected from supernatants of CHO and Me665 cells treated with CT were run on a SDS-PAGE gel in reducing conditions Western blot analysis with a polyclonal antibody for Cav-1 and CT is shown; (C) Optical light microscope (Nikon, magnification ×10) analysis of CHO cells upon addition of extracellular vesicles from control or CT treated CHO cells. EV were collected at different times from cell-conditioned medium, and isolated by differential ultracentrifugation. After isolation, 5 µg of EV were incubated for 6 h with CHO cells. 12 nM CT is used as positive control. At the end of the incubation, cells were analyzed with a light microscope.

