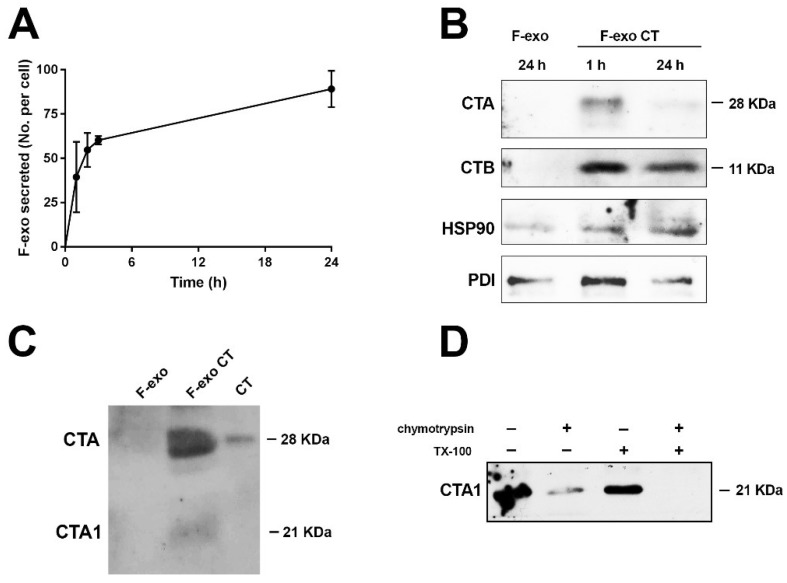
Figure 4.
Exosome biogenesis and analysis of intra/extra localization of CT. (A) Me665 exosome biogenesis. Cells were pulsed with BODIPY C16 for 5 h for cell labeling, washed and complete medium was added. Cell conditioned medium was harvested at different time points for exosome recovery and quantification by FACS. Amount of exo secreted per cell is shown; (B) Western Blot analysis of F-exo CT recovered at 1 h and 24 h subtracted of the 1 h time point. The same number (3 × 10⁷) of F-exo or F-exo CT were run on a non reducing SDS-PAGE gel, and immunoblotted for CTA and CTB subunits, HSP90 and PDI; (C) Western blot analysis of F-exo and F-exo CT (6 × 10⁷) run in non-reducing conditions to show the presence of CTA1 and CTA1 + CTA2 subunits. The monoclonal antibody anti-CTA reveal the presence of both the 28 kDa and the 21 kDa subunits. 0.3 ng of CT were used as positive control; (D) 16 µg of exo CT were incubated with 1 µg of chymotrypsin, in the absence or presence of 0.2% Triton X-100. Samples were then loaded on SDS-PAGE gel in reducing conditions before western blot analysis using a monoclonal antibody anti-CTA.

