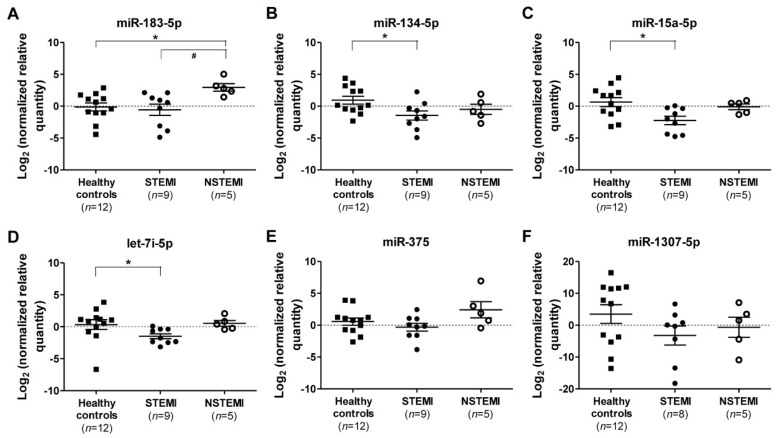
Figure 2.
MiRNAs expression in ACS subtypes. Log2 transformation of normalized relative quantity of (A) miR-183-5p, (B) miR-134-5p, (C) miR-15a-5p, (D) let-7i-5p, (E) miR-375, and (F) miR-1307-5p in healthy controls (n = 12), STEMI (n = 9), and NSTEMI (n = 5) patients. The expressions of the target miRNAs were normalized to both reference miRNAs, i.e., miR-320a and miR-17-5p. Data are shown as the geometric means ± 95% CI, confidence interval. p-values were calculated using one-way ANOVA followed by the Tukey multiple groups comparison test; * indicates p < 0.05 compared to healthy control individuals; and # indicates p < 0.05 compared to NSTEMI patients.

