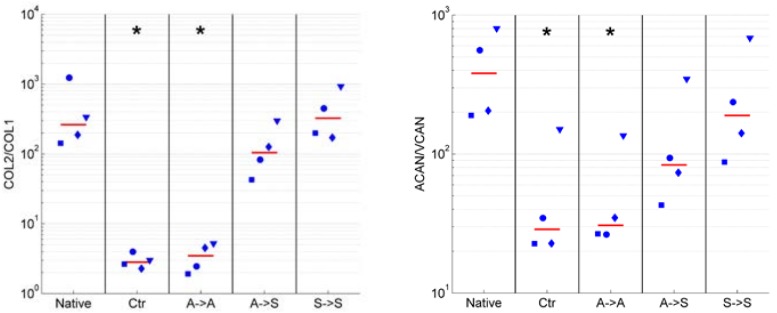
Figure 4.
Chondrocyte dedifferentiation marker. The degree of dedifferentiation was quantified by the mRNA expression ratios of collagen type II to type I (COL2/COL1; left) and aggrecan to versican (ACAN/VCAN; right). High values of these ratios indicate differentiated chondrocytes, whereas low values indicate dedifferentiated cells. The ratios COL2/COL1 and ACAN/VCAN were reduced in adherent cells (Ctr and A->A) and remained high in suspended cells (A->S and S->S). The blue markers indicate the individual values of the four unique animals (unique shape for each animal), and the red line indicates the median from all of the experiments. The asterisks indicate statistically significant difference as compared to the native cells. The nomenclature of the samples is indicated in Figure 1.

