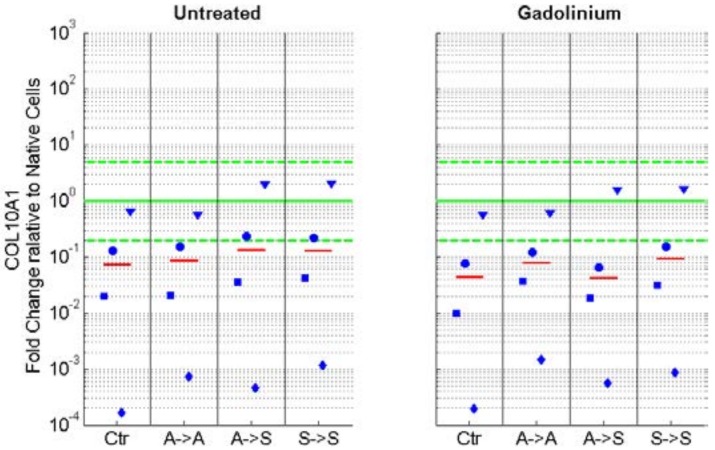
Figure 5.
mRNA expression of collagen type X (COL10), normalized to the gene expression of native cells. Collagen type X expression was generally downregulated in all conditions but showed great variability among the four animals. The blue markers indicate the individual values of the four unique animals (unique shape for each animal), and the red line indicates the median from all experiments. The green horizontal lines indicate the one-fold (no change; solid line) and five-fold upregulation and downregulation (dashed lines), respectively. The nomenclature of the samples is indicated in Figure 1.

