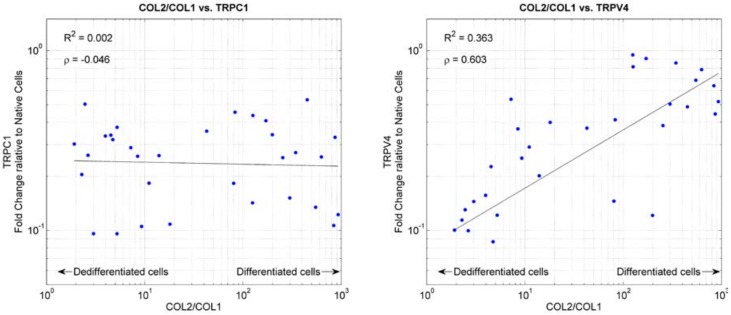
Figure 7.
mRNA expression of TRPC1 (left) and TRPV4 (right) plotted against the chondrocyte dedifferentiation marker COL2/COL1. High values of COL2/COL1 indicate differentiated chondrocytes, whereas low values indicate dedifferentiated cells. The mRNA expression of TRPC1 and TRPV4 was normalized to the respective gene expression of native cells. The black line indicates linear regression of the 10-base logarithm transformed data. R2 indicates the corresponding coefficient of determination. The ρ-value indicates the Pearson’s linear correlation coefficient of the 10-base logarithm transformed data.

