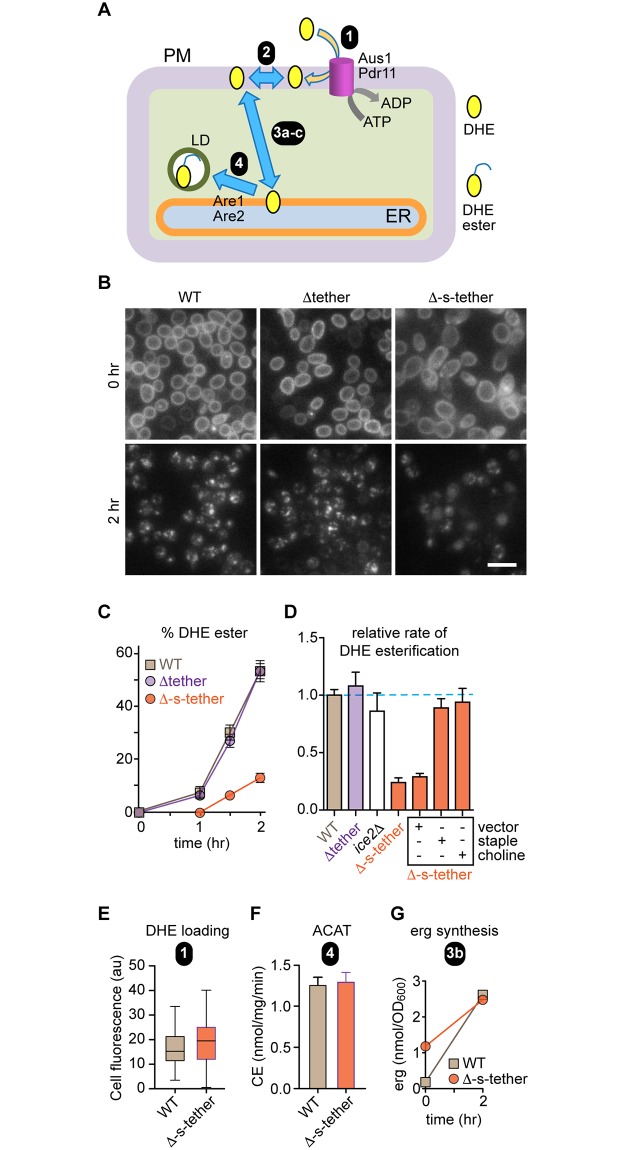
Fig 3. Retrograde transport of exogenously supplied DHE is slowed about 4-fold in Δ-s-tether cells; rescue by expression of an artificial ER-PM tether or choline.
A. Schematic illustration of the retrograde sterol transport assay. The assay measures transport-coupled esterification of exogenously supplied DHE. Cells are incubated with DHE for 36 h under hypoxic conditions to load the sterol into the PM (step 1, mediated by the ABC transporters Aus1 and Pdr11). Further incubation (chase period) after exposing the cells to air results in the exchange of DHE between pools in the PM (step 2) and its transfer to the ER (step 3), where it is esterified (step 4) by the sterol esterification enzymes Are1 and Are2. DHE esters that are sequestered in LDs. B. Representative images of WT, Δtether, and Δ-s-tether cells obtained immediately after DHE loading (chase time = 0 h) and 2 h after incubation under aerobic conditions. The punctae seen in the 2 h chase images correspond to LDs. Scale bar = 10 μm. C. DHE esters were quantified at different times during the aerobic chase period by analyzing hexane/isopropanol extracts of the cells by HPLC equipped with an in-line UV detector. The data are represented as percentage of DHE ester recovered (= DHE ester/(DHE + DHE ester)). Linear regression of the data points between 1 and 2 h indicates relative slopes of 1 (for WT and Δtether cells) and 0.24 ± 0.05 for Δ-s-tether cells (also see panel D). D. Transport-coupled esterification of exogenously supplied DHE. The bar chart presents the mean ± SEM (n = 3) of the relative rate of DHE esterification after the 1 h lag period at the start of the aerobic chase. The mean esterification rate for WT cells is set at 1.0. E. Incorporation of DHE into the PM (corresponding to step 1 in panel A), quantified using fluorescence images acquired immediately after the hypoxic incubation period. The area, integrated fluorescence, and the CTCF were calculated for individual cells using Image J. At least 40 cells were analyzed. CTCF = integrated density − (area of selected cell × mean fluorescence of background reading). The box and whiskers plot shows the mean of the measurements, with whiskers ranging from the minimum to the maximum value measured. F. Microsomes from WT and Δ-s-tether cells were assayed for their ability to esterify [3H]cholesterol (supplied as a complex with methyl-β-cyclodextrin) on addition of oleoyl-CoA. Esterification, assessed by organic solvent extraction and thin layer chromatography, proceeded linearly for at least 10 min. The bar chart shows the mean ± SEM (n = 4) of ACAT activity as the rate of production of CE per mg microsomal protein per minute. This measurement corresponds to step 4 in panel A. G. The amount of ergosterol in WT and Δ-s-tether cells (nmol per OD600 of cell suspension) was measured by lipid extraction and HPLC at the start and end of the aerobic chase period. This measurement corresponds to step 3a in panel A (see text for details). Numerical data presented in this figure may be found in S1 Data. Δ-s-tether, Δ-super-tether; ABC, ATP-binding cassette; ACAT, acetyl-CoA acetyltransferase; ADP, adenosine diphosphate; CE, cholesteryl ester; CoA, coenzyme A; CTCF, corrected total cell fluorescence; DHE, dehydroergosterol; ER, endoplasmic reticulum; HPLC, high-performance liquid chromatography; LD, lipid droplet; PM, plasma membrane; UV, ultraviolet; WT, wild type.

