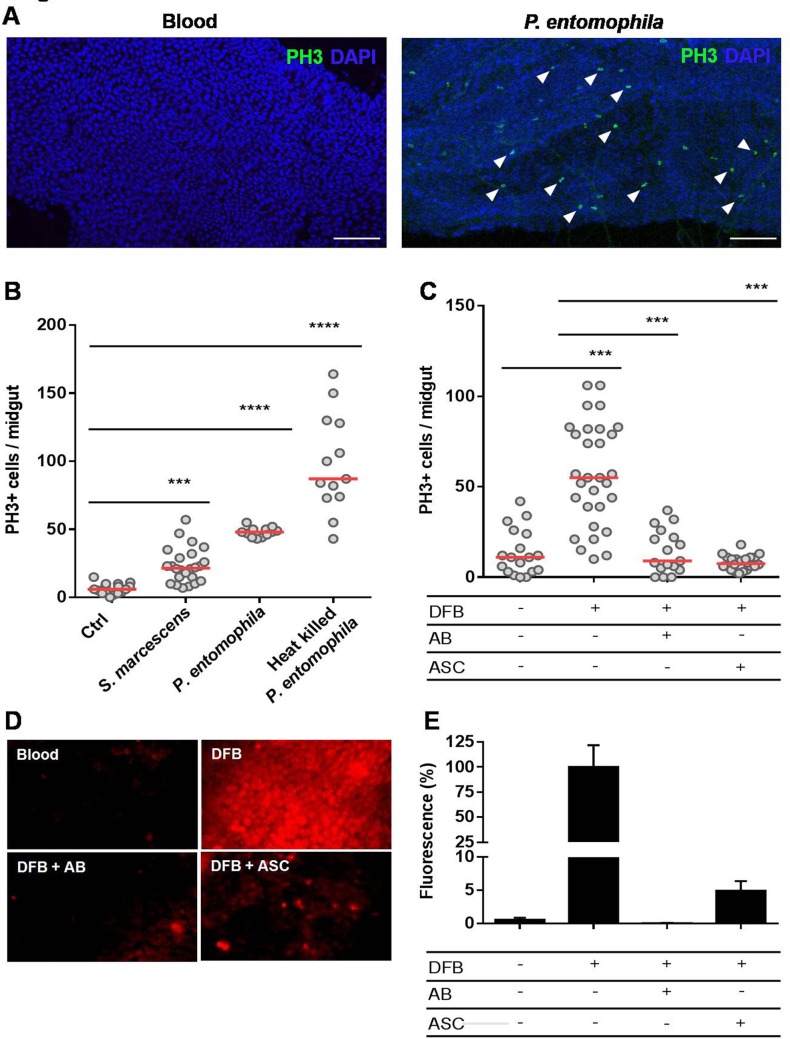
Fig 2. The peritrophic matrix shapes intestinal homeostasis by limiting contact of the gut epithelium with the microbiota and preventing ROS production.
Red strain mosquitoes were fed on normal blood or blood infected with non-pathogenic S. marcescens or entomopathogenic P. entomophila bacteria. Another group of mosquitoes was fed blood supplemented with heat-killed P. entomophila. The midguts were dissected 24 hours after feeding and immunostained for PH3. (A) Representative images of PH3-labeled mitotic cells (green) of the midgut epithelium 24 h after a naïve blood meal or blood infected with P. entomophila. The nuclei are stained with DAPI (blue). The arrowheads indicate PH3+ cells. Scale bar = 100 μm (B) Total PH3-positive cells were quantified from the midguts of mosquitoes fed on naïve and bacteria-infected blood (n = 25) or heat-inactivated P. entomophila. (n = 12). The medians of three independent experiments are shown. The asterisks indicate significantly different values *** P<0.001 and **** P<0.0001 (Student’s t-test). (C) Inhibition of PM formation results in a significant increase of progenitors cells under mitosis. The mosquitoes were fed blood or blood supplemented with diflubenzuron (DFB), DFB plus an antibiotic cocktail (AB) or DFB plus 50 mM ascorbate (ASC). The midguts were dissected 24 hours after feeding, and the mitotic indices were quantified by counting PH3+ cells. The medians of at least three independent experiments are shown (n = 30). The asterisks indicate significantly different values *** P<0.001 and **** P<0.0001 (Student’s t-test). (D) Assessments of reactive oxygen species in the midguts were conducted by incubating midguts of insects fed as in (C) with a 50 μM concentration of the oxidant-sensitive fluorophore DHE. (E) Quantitative analysis of the fluorescence images shown in (D) were performed using ImageJ 1.45s software (n = 7–9 insects).

