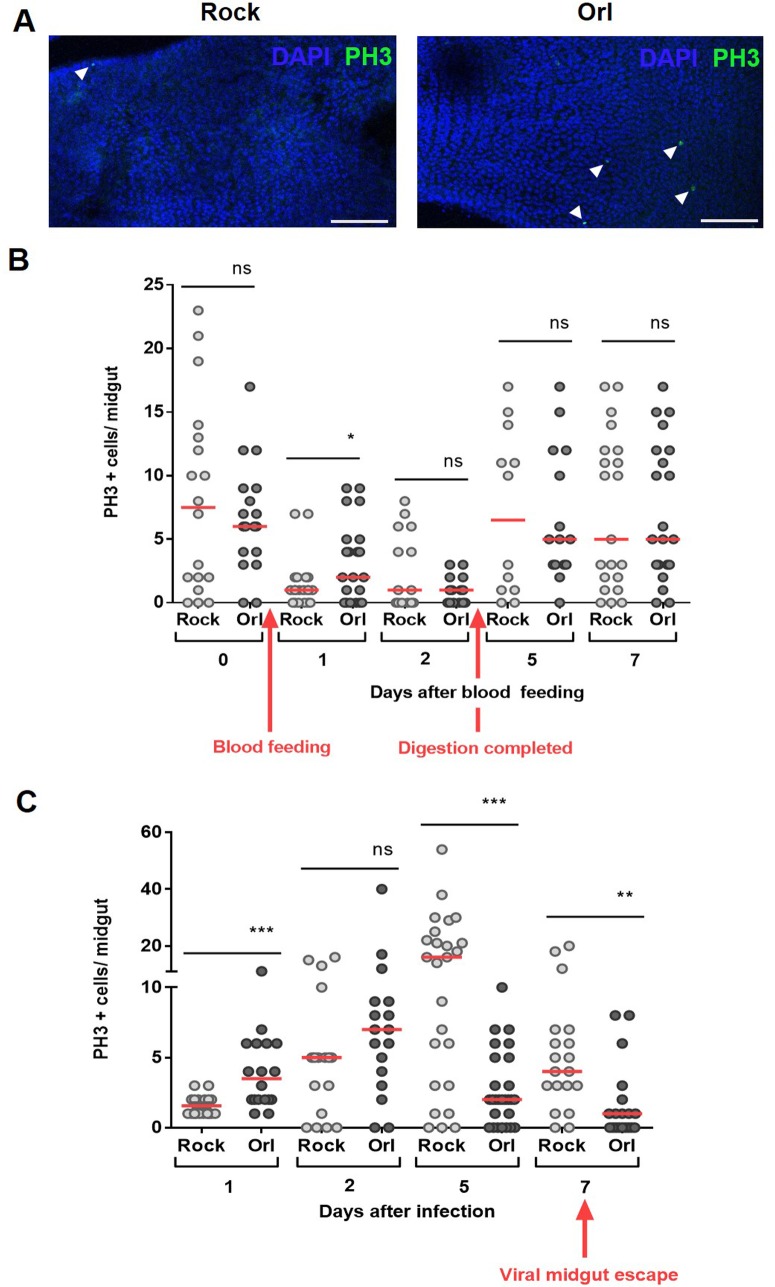
Fig 3. Dengue virus infection impacts midgut homeostasis in a strain specific manner.
(A) Blood feeding induces different levels of PH3 positive cells in the midgut of the susceptible (Rock) and refractory (Orl) strains 24 hours after the meal. Representative images of PH3 labeling in both strains 24 hours after the blood meal. The nuclei are stained with DAPI. The arrowheads indicate PH3+ cells. Scale bar = 100 μm. (B) Mosquitoes from the two strains were blood fed and at day zero (non blood-fed) or at different days after feeding, the midguts were dissected and immunostained for PH3. The red arrows indicate the time of blood feeding and the time in which the digestion is completed (after blood bolus excretion). In (C) the mosquitoes were fed on DENV2-infected blood and mitotic-cell counting was performed at different days after infection. The red arrow indicates the time of DENV escape from the midgut to hemocoel. The medians of at least three independent experiments are shown (n = 30). The asterisks indicate significantly different values * P<0.05 ** P<0.01 and *** P<0.001 (Student’s t-test).

