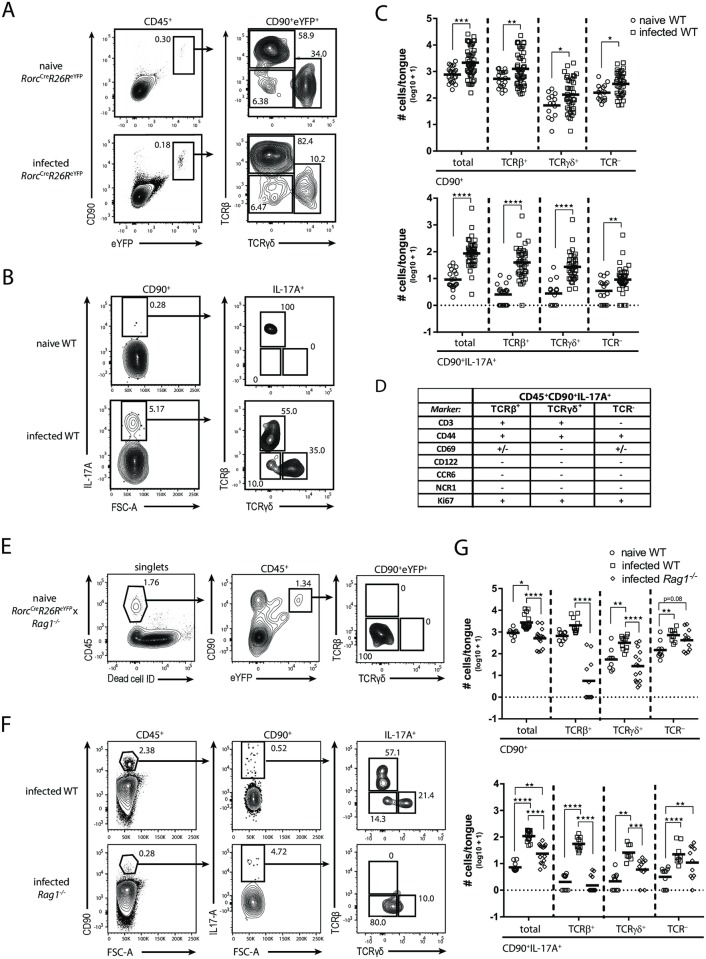
Fig 1. IL-17A is expressed by a tripartite population of CD90+ leukocytes during acute OPC.
(A) CD90+eYFP+ cells in the tongue of naïve and infected RorcCreR26ReYFP mice were analyzed for TCRβ and TCRγδ expression. Pre-gating is on CD45+ cells. Representative FACS plots from one out of two independent experiments are shown. Numbers indicate the % of parent in each gate. (B) Representative analysis of the CD90+IL-17A+ subsets in the tongue of naïve and infected WT animals. Pre-gating is on CD45+CD90+ cells. Numbers indicate the % of parent in each gate. (C) Summary plot with absolute numbers of CD90+ and CD90+IL-17A+ cells and the respective TCRβ+, TCRγδ+ and TCR- subsets according to the analysis shown in B. Each symbol represents one animal, the mean of each group is indicated. Graphs show pooled data from 12 independent experiments. (D) Surface and proliferation markers expressed by the three CD90+IL-17A+ subsets in the infected tongue of WT mice. (E) Analysis of CD90+eYFP+ cells in the tongue of naïve RorcCreR26ReYFP x Rag1-/- mice. Pre-gating is on single and viable cells. Numbers indicate the % of parent in each gate. Representative plots from one out of two independent experiments are shown. (F) Representative analysis of CD90+IL-17A+ subsets in the tongue of infected WT and Rag1-/- mice. Pre-gating is on CD45+ cells. Numbers indicate the % of parent in each gate. (G) Summary plots with absolute numbers of CD90+ and CD90+IL-17A+ cells and the respective TCRβ+, TCRγδ+ and TCR- subsets according to the analysis shown in F. Each symbol represents one animal, the mean of each group is indicated. Graphs show pooled data from four independent experiments. *p<0.05; **p<0.01, ***p<0.001; ****p<0.0001. See also S1 and S2 Figs.

