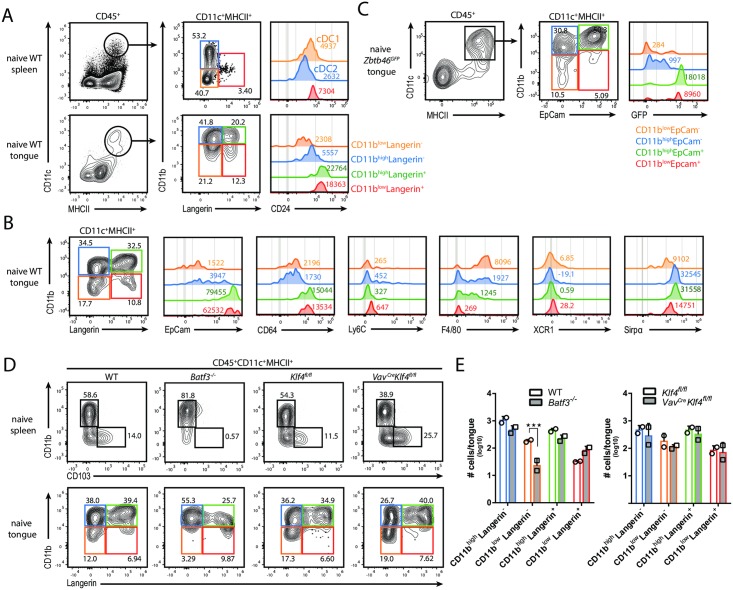
Fig 3. The MNP network in the tongue during steady state.
(A) Phenotypic characterization of tongue-resident CD11c+MHCII+ MNPs in naïve WT mice. Spleen cells were also analyzed as a control. On the basis of CD11b and Langerin expression, CD11c+MHCII+ MNPs were divided in three (in the spleen, upper row) or four subsets (in the tongue, lower row), respectively, and analyzed for CD24 expression. (B) Tongue-resident CD11c+MHCII+ MNP subsets in naïve WT mice were analyzed for the expression of EpCam, CD64, Ly6C, F4/80, XCR1 and Sirpα. FACS plots are representative of one out of three independent experiments with 2 animals each. Pre-gating is on CD45+CD11c+MHCII+ MNPs. (C) Tongue-resident CD11c+MHCII+ MNP subsets in naïve Zbtb46GFP reporter mice were analyzed for the expression of GFP. FACS plots in A and C are representative of one out of two independent experiments with one animal each. Pre-gating is on CD45+ cells. Numbers in the histograms in A to C indicate MFI (median) of the indicated markers. (D-E) Comparison of spleen and tongue-resident CD11c+MHCII+ MNP subsets in WT versus Batf3-/- and Klf4fl/fl versus VavCreKlf4fl/fl mice, respectively. Pre-gating is on CD45+MHCII+CD11c+ cells. Representative FACS plots are shown in D and summary graphs with absolute numbers of CD11c+MHCII+ MNP subsets in the indicated genotypes are shown in E. Each symbol represents one animal, the mean of each group is indicated. Data are representative of one out of two independent experiments. (***p<0.001). See also S4 Fig.

