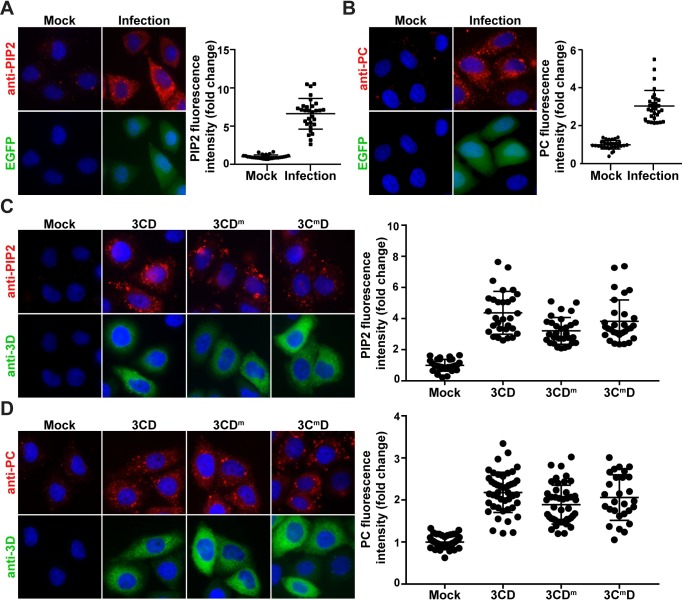
Fig 9. 3CD uses distinct mechanisms to induce different lipids.
(A) PV infection induces PIP2. HeLa cells were infected with WT PV expressing EGFP at an MOI of 10 and immunostained for PIP2 (red). EGFP (green) indicates infected cells, and DAPI (blue) marks the nuclei. PIP2 was quantified as described for PI4P in the legend to Fig 1C. The averages of the normalized values were: 1.00 ± 0.05 (SEM) in mock-infected cells and 6.62 ± 0.37 (SEM) in PV-infected cells. The difference was significant based on a Student’s t-test, which gave a P value of <0.0001. (B) PV infection induces PC. Experiment was performed as described in panel A. Cells were immunostained for PC (red). PC was quantified as described for PI4P in the legend to Fig 1C. The averages of the normalized values were: 1.00 ± 0.04 (SEM) in mock-infected cells and 3.03 ± 0.15 (SEM) in PV-infected cells. The difference was significant based on a Student’s t-test, which gave a P value of <0.0001. (C) Induction of PIP2 by 3CD, 3CDm and 3CmD. HeLa cells were transfected with various 3CD mRNAs and fixed 4 h post-transfection. Cells were immunostained for PIP2 (red) and 3CD (green). Nucleus was stained with DAPI (blue). Quantification of PIP2 intensity per cell was performed as described for PI4P in the legend to Fig 1C. The averages of the normalized values were: 1.00 ± 0.07 (SEM) in mock-transfected cells; 4.37 ± 0.25 (SEM) in 3CD-transfected cells; 3.21 ± 0.16 (SEM) in 3CDm-transfected cells; and 3.82 ± 0.25 (SEM) in 3CmD co-transfected cells. The level of PIP2 induction observed in 3CD (WT and mutant)-transfected cells was significant when compared to mock-transfected cells based on a Student’s t-test, which gave a P value of <0.0001. For 3CD vs 3CDm, 3CD vs 3CmD and 3CDm vs 3CmD, a Student’s t-test yielded P values of 0.0002, 0.1264 and 0.0047, respectively. (D) Induction of PC by 3CD, 3CDm and 3CmD. Experiment was performed as in panel C. Cells were immunostained for PC (red) and 3CD (green). Quantification of PC intensity per cell was performed as described for PI4P in the legend to Fig 1C. The averages of the normalized values were: 1.00 ± 0.02 (SEM) in mock-transfected cells; 2.18 ± 0.07 (SEM) in 3CD-transfected cells; 1.89 ± 0.07 (SEM) in 3CDm-transfected cells; and 2.06 ± 0.10 (SEM) in 3CmD co-transfected cells. The level of PC induction observed in 3CD (WT and mutant)-transfected cells was significant when compared to mock-transfected cells based on a Student’s t-test, which gave a P value of <0.0001. For 3CD vs 3CDm, 3CD vs 3CmD and 3CDm vs 3CmD, a Student’s t-test yielded P values of 0.0041, 0.3129 and 0.1583, respectively.

