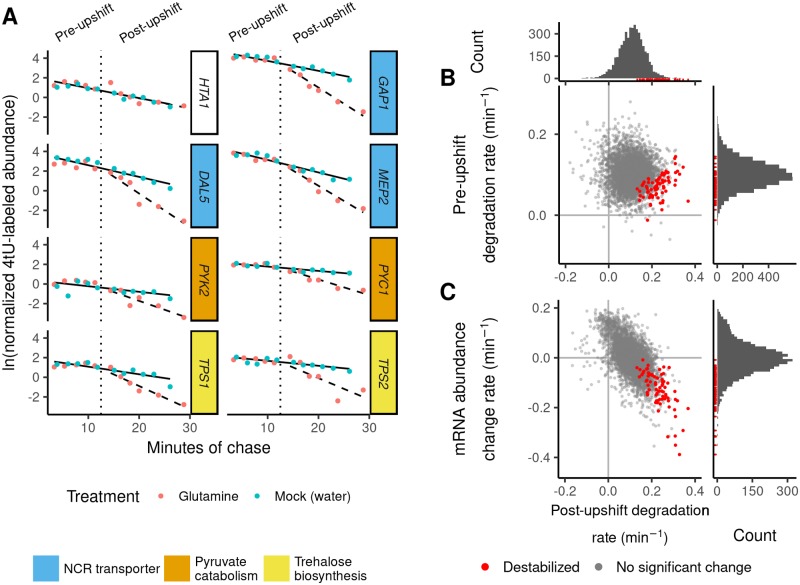
Fig 2. Global mRNA stability changes following a nitrogen upshift.
A) 4tU-labeled mRNA from each gene was measured over time, before and after the addition (vertical dotted line) of glutamine (nitrogen-upshift) or water (mock). Linear regression models were fit to the data with a rate before the upshift (solid line) and a change in rate after glutamine addition (dashed line). HTA1 is not significantly destabilized, whereas mRNAs encoding NCR-regulated transporters or pyruvate and trehalose metabolism components are significantly destabilized. Plots for all genes are available in the associated Shiny application (Methods). B) Comparison between the pre-upshift mRNA degradation rate (y-axis) and the post-upshift mRNA degradation rate (x-axis). Details of modeling are in S1 Appendix. C) Comparison between changes in mRNA expression following upshift [25] (y-axis) and the post-upshift degradation rate (x-axis). Transcripts that are significantly destabilized are colored red, and shown with red rug-marks in the marginal histograms.

