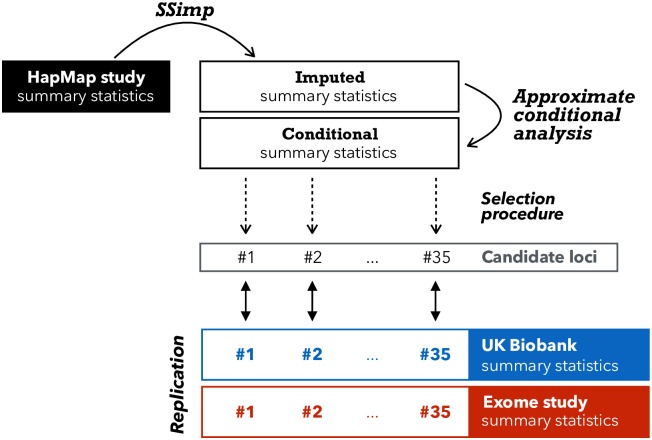
Fig 2. Overview of imputation and replication scheme.
This illustration gives an overview how we used > 2M GIANT HapMap summary statistics (black rectangle) as tag SNVs to impute > 10M variants with MAF≥ 0.1% in UK10K. After adjusting the summary statistics for conditional analysis we applied a selection process that resulted in 35 candidate loci. To confirm these 35 loci we used summary statistics from UK Biobank (blue) as replication as well as summary statistics from the exome chip study, if available [13] (red). Loci that had not been discovered by the exome chip study, were termed novel.

