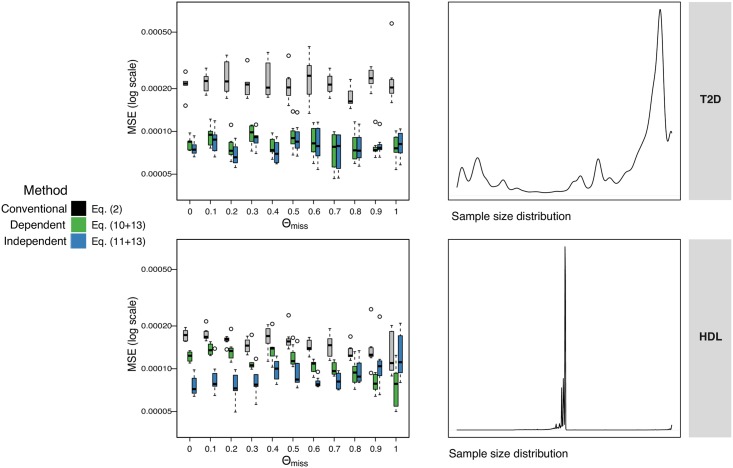
Fig 3. Accounting for variable sample size.
Effect of missingness on accuracy of imputation of standardised effects, evaluated via simulations where true effect is known. The y-axis is the MSE (on log-scale) between the true standardised effect and the conventional estimate which ignores missingness (Eq (1), grey), our estimate D(dep) (Eq (10), green), and our estimate D(ind) (Eq (11), blue). The x-axis is the ‘missingness-correlation’ (θmiss), where a value of 1 means the number of individuals in the samples had maximum overlap with each other, and 0 means they were simulated independently leading to smaller overlap. Each boxplot shows the MSEs across the 40 regions simulated. Top row is where the N’s (simulated sample sizes) are selected randomly from a study of T2D [31], with sample sizes varying between 13 and 110′219 individuals. Bottom row is based on HDL [30], with sample sizes ranging between 50′000 and 187′167 individuals. All sample sizes are scaled to 0-to-12500 as this is the size of the simulated GWAS.

