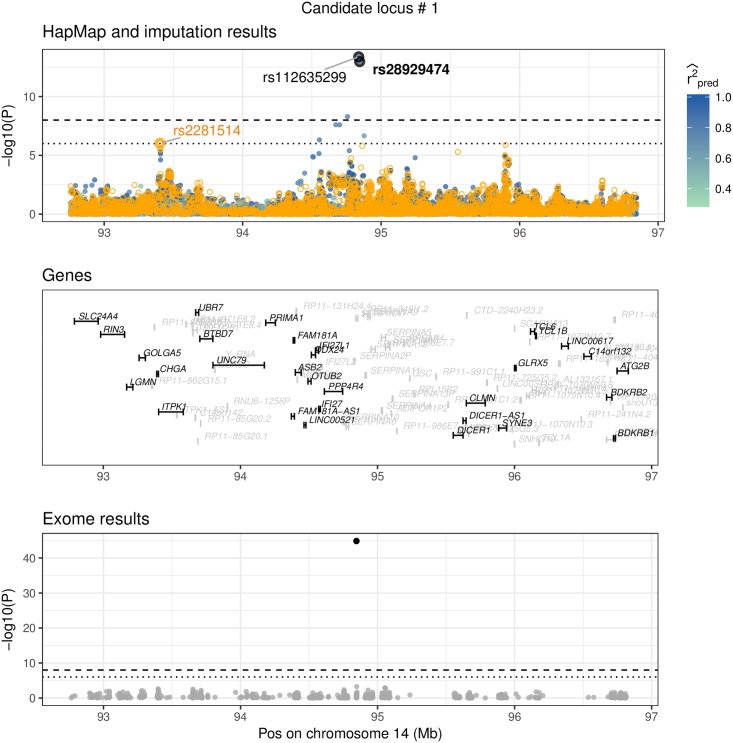
Fig 8. Replication of exome variant.
rs28929474 is a missense variant on chromosome 14 in gene SERPINA1, low-frequency (MAF = 2.3%), imputed summary statistics (PSSimp = 1.06×−13), replication in the UK Biobank (PUKBB = 6.49×−78). rs112635299 has the strongest signal in this region (P = 4.21 × 10⁻¹⁴), but is highly correlated to rs28929474 (LD = 0.95). This figure shows three datasets: Results from the HapMap and the exome chip study, and imputed summary statistics. The top window shows HapMap P-values as orange circles and the imputed P-values (using summary statistics imputation) as solid circles, with the colour representing the imputation quality (only shown). The bottom window shows exome chip study results as solid, grey dots. Each dot represents the summary statistics of one variant. The x-axis shows the position (in Mb) on a ≥ 2 Mb range and the y-axis the −log10(P)-value. The horizontal line shows the P-value threshold of 10−6 (dotted) and 10−8 (dashed). Top and bottom window have annotated summary statistics: In the bottom window we mark dots as black if it is are part of the 122 reported hits of [13]. In the top window we mark the rs-id of variants that are part of the 122 reported variants of [13] in bold black, and if they are part of the 697 variants of [12] in bold orange font. Variants that are black (plain) are imputed variants (that had the lowest conditional P-value). Variants in orange (plain) are HapMap variants, but were not among the 697 reported hits. Each of the annotated variants is marked for clarity with a bold circle in the respective colour. The genes annotated in the middle window are printed in grey if the gene has a length < 5′000 bp or is an unrecognised gene (RP-).

