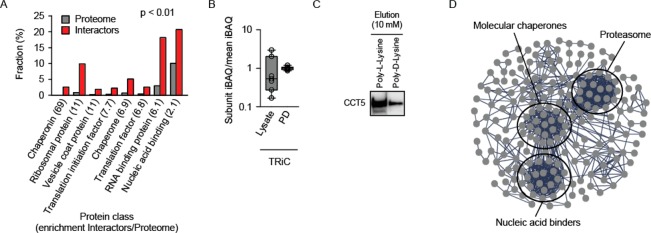
Figure 3.
Protein function analysis of the PL interactors identifies a strong enrichment of the members from the proteostasis network. (A) Significant hits (p < 0.01) of the PANTHER over-representation test sorted according to the enrichment factor, which is indicated in the brackets. (B) The box plot of the distribution of iBAQ values of individual subunits normalized by the mean iBAQ of all subunits of the chaperonin TRiC. (C) Biochemical verification of TRiC pulldown by poly-L-lysine agarose as performed for mass spectrometry analysis. An antibody against TRiC subunit CCT5 was used for Western blotting. The elution of agarose-bound proteins was done with 10 mM poly-L-lysine or poly-D-lysine. (D) The STRING connectivity analysis identifies two clusters of the members from the proteostasis network (molecular chaperones and the proteasome). Ribosomal proteins and unconnected nodes were excluded to improve visualization.

