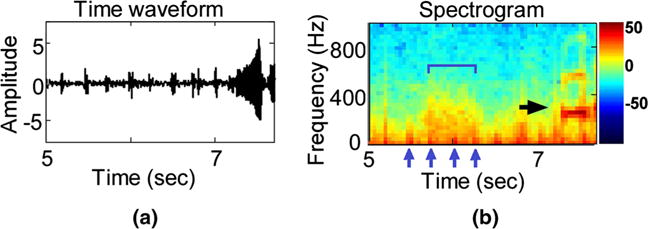
Fig. 1.

Recording excerpt of one study subject. Top the time waveform. Bottom the corresponding spectrogram representation, calculated on a 64 ms Hanning window with 50 % overlap. A processing window of 2-s duration is marked within the black margins. The two arrows indicate recorded noise, in the form of stethoscope movement (short burst of energy at 4.9 s) and cry (longer duration interval starting at 7.2 s). The color bar is shown in decibels (db)
