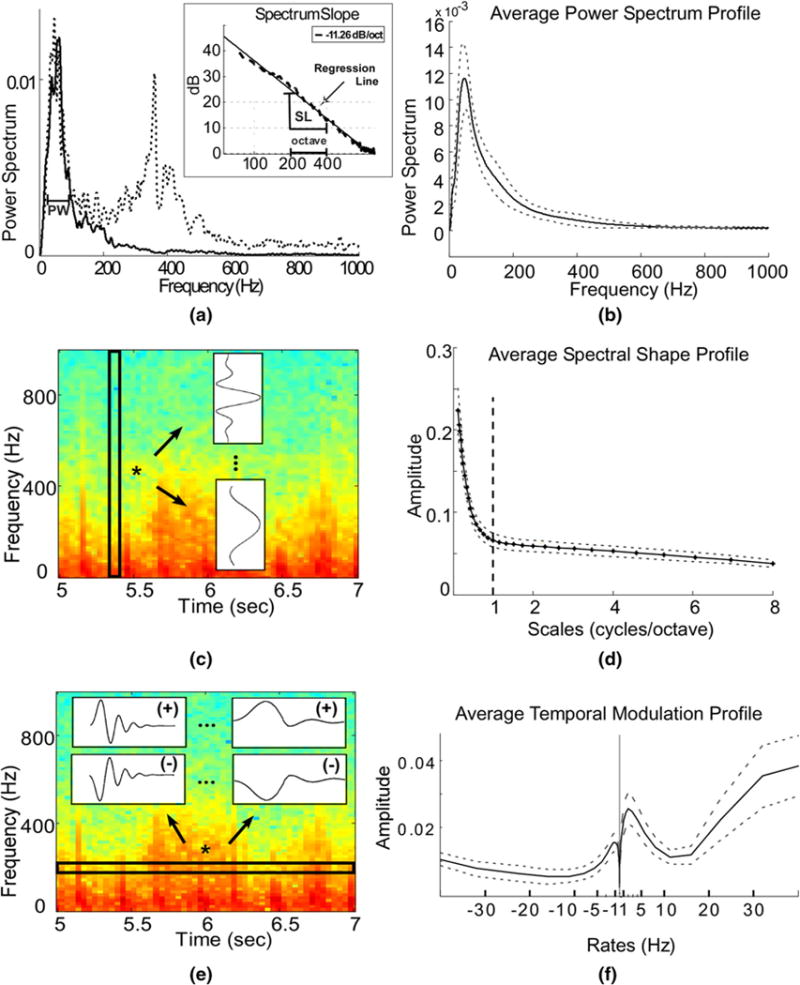
Fig. 2.

a Power spectrum computed from the 2-s window marked in Fig. 1 bottom, and a power spectrum of an interval containing crying (dashed line). The peak width feature (PW) is marked. Inset shows the logarithmic spectrum (dashed line) and the corresponding regression line (solid line). The slope of the regression line (SL) is −11.26 dB/octave and is marked together with an octave interval. b The average subject profile of the power spectrum, as calculated using a short-time FFT, smoothed with a Butterworth low-pass filter. The dashed lines depict variations among different subjects. c Schematic representation for the extraction of the Spectral shape profile. Spectrogram information was processed for each time index and passed through a bank of 31 filters varying from narrowband (ex. top filter shown), capturing the peaky contents, to broadband (ex. bottom filter shown) capturing the smooth contents. For display purposes, spectrogram was computed on a 64 ms Hanning window with 50 % overlap. d The average profile for the spectral shape over all subjects. Dashed lines depict the variation among subjects, and the vertical bold line indicates the separation of contents below and above 1 cycle/octave. e Schematic representation for the extraction of the temporal modulation profile. Spectrogram information was processed along each frequency band and passed through a bank of 23 filters varying from high/fast rates (filters shown on the left) to low/slow rates (filters shown on the right), for both positive phase-downward direction (+) and negative phase-upward direction (−), capturing the changes of the frequency content along time. For display purposes spectrogram was computed on a 64 ms Hanning window with 50 % overlap. f The average profile for the temporal modulations over all subjects. Dashed lines depict the variation among subjects. Notice the strong energy around the region of −1 Hz and 2 Hz
