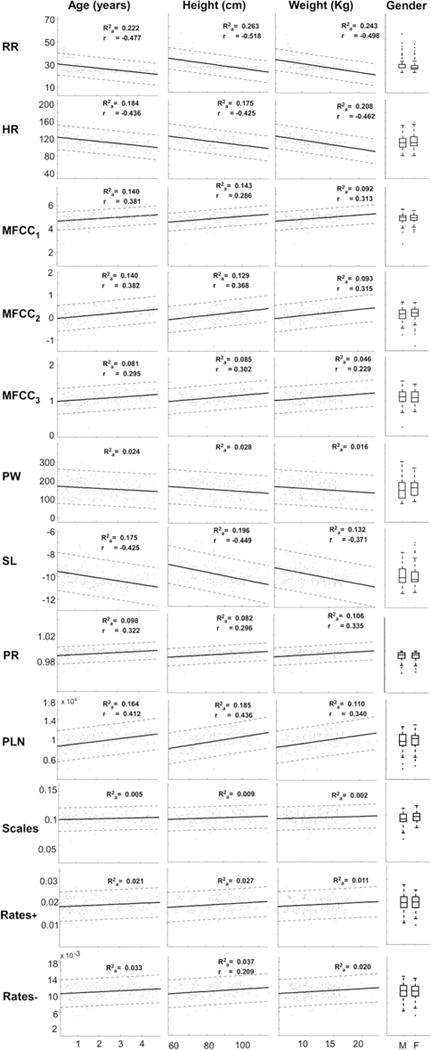
Fig. 3.

Linear fit (solid line) for each feature (rows, y axis) with respect to patient characteristics (columns, x axis). Point-wise prediction bounds (see Online Supplement) with 95 % confidence level are also shown with dashed lines. Inset , the adjusted coefficient of determination of the quadratic fit; r, the linear correlation coefficient, displayed only if a significant correlation (P value <0.01) was achieved. Gender column: boxplots for boys (M) and girls (F). HR: heart rate, RR: respiratory rate, MFCC1,2,3: Mel-frequency cepstrum coefficients for filters centered at 56, 116, and 181 Hz, respectively, PW: spectrum peak width, SL: slope of regression line fit of the logarithmic spectrum, PR: power ratio of the total calculated power versus the power of the regression line, PLN: total power of the regression line
