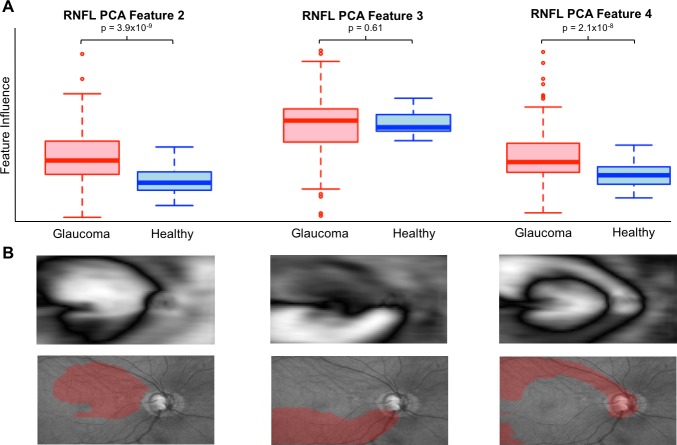
Figure 3.
Illustration of the relationship between 3 example RNFL PCA features with (A) disease and (B) RNFL thinning. (A) Box plots showing the distribution of RNFL PCA features for glaucoma (red) and healthy eyes (blue). (B) RNFL PCA features (top) and the areas of greatest RNFL thinning associated with each overlaid on en face images (bottom, in red). RNFL PCA feature 2 shows a broad area of RNFL thinning that includes nasal and superior regions surrounding the macula. RNFL PCA features 3 and 4 identify thinning of superior and superior arcuate nerve fiber bundles.

