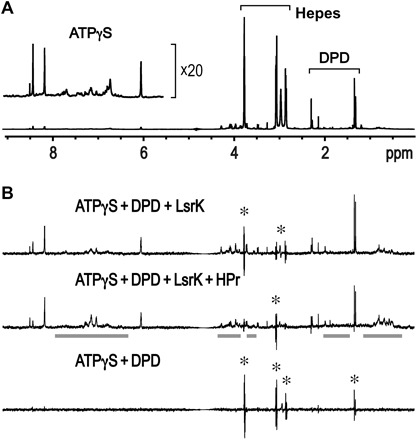
Fig. 5. 1D STD NMR experiments of ATPγS and DPD in the presence of LsrK and HPr proteins.

(A) The peak intensities of the 1D NMR spectrum reflect the relative concentrations of ATPγS (1 mM) and DPD (10 mM racemic mixture). (B) A small molecule displaying a binding exchange process with target proteins produces positive peaks in the 1D STD spectra. An incomplete cancellation due to slightly different peak shapes between two 1D spectra obtained with on- and off-saturation at 0.5 and 30 ppm, respectively, resulted in the peak spikes with both positive and negative signs (marked with an asterisk). Overall integration of the peak spike is zero, and thus, the molecule corresponding to the peak spikes is shown not to bind to LsrK. The residual protein peaks in the 1D STD spectrum are indicated with bold gray lines. The saturation transfer efficiency from the LsrK/HPr protein to DPD was much lower than that of ATPγS (top), which means that the LsrK/HPr protein exhibited much less binding to DPD than to ATPγS. The presence of an additional HPr further decreased the peak intensities of DPD (middle). The 1D STD spectrum in the absence of the proteins did not produce any positive peaks (bottom).
