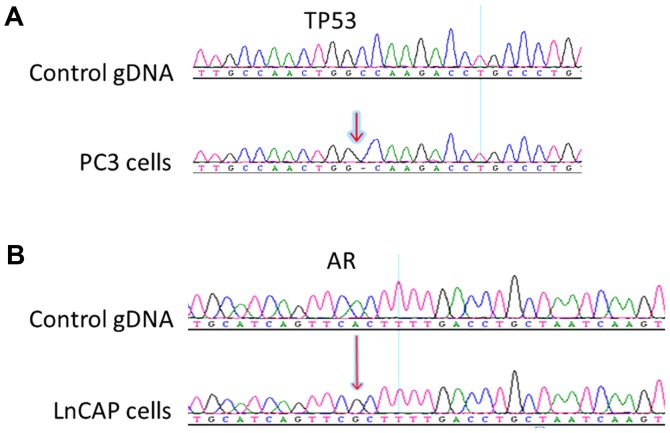
Figure 2.
Sanger sequencing results of the nested PCR amplicons from PC3 and LNCaP cells. (A) Sequencing results of TP53 from control gDNA (upper panel) and PC3 cells (lower panel), revealing a deletion in TP53 from PC3 cells. (B) Sequencing results of AR from control gDNA (upper panel) and LNCaP cells (lower panel), revealing a missense mutation in AR from LNCaP cells.

