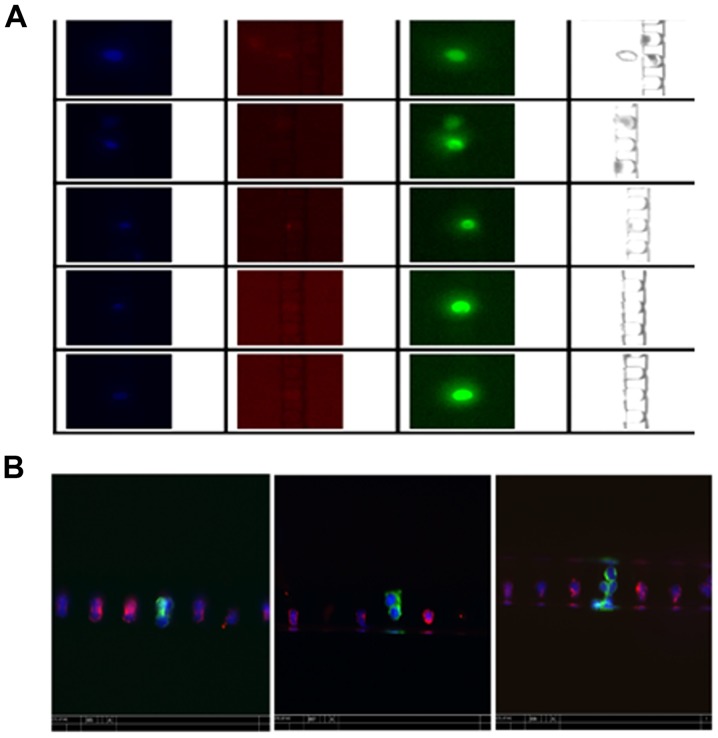
Figure 3.
Representative images of the enriched cells using Celsee PREP100. Green, red and blue signals indicate cytokeratins and DAPI-positive, CD45-negative and nuclei, respectively. (A) Images from individual channels. (B) Composite images from all 3 channels revealing differential staining of CTCs (green) and leukocytes (red). It also revealed that circulating tumor cells (CTCs) are captured as a single cell, double cells and cell clusters.

